
Title stata.com
putdocx table — Add tables to an Office Open XML (.docx) file
Description Quick start Syntax Options
Remarks and examples Stored results Reference Also see
Description
putdocx table creates and modifies tables in the active .docx file. Tables may be created from
several output types, including the data in memory, matrices, and estimation results.
putdocx describe describes a table within the active .docx file.
set docx maxtable allows you to set the maximum number of tables allowed in putdocx.
Quick start
Add a table named tbl1 with three rows and four columns to the document
putdocx table tbl1 = (3,4)
Set the content of the cell on the first row and first column of tbl1 to be “My graph” and align the
text to the right
putdocx table tbl1(1,1) = ("My graph"), halign(right)
Insert the image in mygraph.png into the second cell in the first column
putdocx table tbl1(2,1) = image(mygraph.png)
Format the contents in columns two through four with two decimal places
putdocx table tbl1(.,2/4), nformat(%5.2f)
Describe the contents of table tbl1
putdocx describe tbl1
Add a table named tbl2 with regression results after regress
putdocx table tbl2 = etable
Same as above, and add a title
putdocx table tbl2 = etable, title("First regression")
Add a table of all returned scalars stored after summarize
putdocx table tbl3 = rscalars
Add a table of the data stored in variables var1 and var2 from the dataset in memory
putdocx table tbl4 = data(var1 var2)
Add a table with the contents of matrix matrix1, including the row and column names of the matrix
putdocx table tbl5 = matrix(matrix1), rownames colnames
Add a table with no borders to the header report1
putdocx begin, header(report1)
putdocx table tbl6 = (1,2), border(all,nil) toheader(report1)
1

2 putdocx table — Add tables to an Office Open XML (.docx) file
Syntax
Add table to document
putdocx table tablename = (nrows, ncols)
, table options
putdocx table tablename = data(varlist)
if
in
, varnames obsno
table options
putdocx table tablename = matrix(matname)
, nformat(% fmt) rownames colnames
table options
putdocx table tablename = mata(matname)
, nformat(% fmt) table options
putdocx table tablename = etable
(#
1
#
2
. . . #
n
)
, table options
putdocx table tablename = returnset
, table options
Add content to cell
putdocx table tablename(i, j) = (exp)
, cell options exp options
putdocx table tablename(i, j) = image(filename)
, image options cell options
putdocx table tablename(i, j) = table(mem tablename)
, cell options
Alter table layout
putdocx table tablename(i, .) , row col options
putdocx table tablename(., j), row col options
Customize format of cells or table
putdocx table tablename(i, j), cell options
putdocx table tablename(numlist
i
, .), cell fmt options
putdocx table tablename(., numlist
j
), cell fmt options
putdocx table tablename(numlist
i
, numlist
j
), cell fmt options
putdocx table tablename(., .), cell fmt options
Describe table
putdocx describe tablename
Set the maximum number of tables
set docx maxtable #
, permanently
# is any number between 1 and 10,000; the default is 500.
putdocx table — Add tables to an Office Open XML (.docx) file 3
tablename specifies the name of a table. The name must be a valid name according to Stata’s naming
conventions; see [U] 11.3 Naming conventions.
table options Description
memtable keep table in memory rather than add it to document
width(#
unit | %
| matname) set table width
halign(hvalue) set table horizontal alignment
indent(#
unit
) set table indentation
layout(layouttype) adjust column width
cellmargin(cmarg, #
unit
) set margins for each table cell
cellspacing(#
unit
) set spacing between adjacent cells and the edges of the
table
border(bspec) set pattern, color, and width for border
headerrow(#) set number of the top rows that constitute the table header
title(string
, cell fmt options
) add a title to the table
note(string
, cell fmt options
) add a note to the table
toheader(hname) add the table to the header hname
tofooter(fname) add the table to the footer fname
cell options Description
append append objects to current content of cell
rowspan(#) merge cells vertically
colspan(#) merge cells horizontally
span(#
1
, #
2
) merge cells both horizontally and vertically
linebreak
(#)
add line breaks into the cell
cell fmt options options that control the look of cell contents
exp options Description
pagenumber append the current page number to the end of exp
totalpages append the number of total pages to the end of exp
trim remove the leading and trailing spaces in exp
hyperlink(link) add the expression as a hyperlink
bookmark(bmname) add the expression as a bookmark named bmname
bookmarklink(bmname) link the expression to bookmark bmname
image options Description
width(#
unit
) set image width
height(#
unit
) set image height
linebreak
(#)
add line breaks after image
link insert link to image file
alt(text) alternative text to be read by voice software
4 putdocx table — Add tables to an Office Open XML (.docx) file
row col options Description
nosplit prevent row from breaking across pages
addrows(#
, before | after
) add # rows in specified location
addcols(#
, before | after
) add # columns in specified location
drop drop specified row or column
∗
width(#
unit | %
) set the column width
∗
height(#
unit
, atleast | exact
) set the row height
cell fmt options options that control the look of cell contents
∗
width() may only be specified when formatting a column.
∗
height() may only be specified when formatting a row.
cell fmt options Description
halign(hvalue) set horizontal alignment
valign(vvalue) set vertical alignment
border(bspec) set pattern, color, and width for border
shading(sspec) set background color, foreground color, and fill pattern
nformat(% fmt) specify numeric format for cell text
font(fspec) set font, font size, and font color
bold format text as bold
italic format text as italic
∗
script(sub | super) set subscript or superscript formatting of text
strikeout strikeout text
underline
(upattern)
underline text using specified pattern
allcaps format text as all caps
smallcaps format text as small caps
∗
May only be specified when formatting a single cell.
unit may be in (inch), pt (point), cm (centimeter), or twip (twentieth of a point). An inch is equivalent
to 72 points, 2.54 centimeters, or 1440 twips. The default is in.
bspec is
bordername
, bpattern
, bcolor
, bwidth
bordername specifies the location of the border.
bpattern is a keyword specifying the look of the border. The most common patterns are single,
dashed, dotted, and double. The default is single. For a complete list of border patterns,
see Border patterns of [RPT] Appendix for putdocx. To remove an existing border, specify nil
as the bpattern.
bcolor specifies the border color.
bwidth is defined as #
unit
and specifies the border width. The default border width is
0.5 points. If # is specified without the optional unit, inches is assumed. bwidth may be ignored
if you specify a width larger than that allowed by the program used to view the .docx file.
We suggest using 12 points or less or an equivalent specification.

putdocx table — Add tables to an Office Open XML (.docx) file 5
sspec is
bgcolor
, fgcolor
, fpattern
bgcolor specifies the background color.
fgcolor specifies the foreground color. The default foreground color is black.
fpattern specifies the fill pattern. The most common fill patterns are solid for a solid color
(determined by fgcolor), pct25 for 25% gray scale, pct50 for 50% gray scale, and pct75 for
75% gray scale. A complete list of fill patterns is shown in Shading patterns of [RPT] Appendix
for putdocx.
fspec is
fontname
, size
, color
fontname may be any valid font installed on the user’s computer. If fontname includes spaces,
then it must be enclosed in double quotes.
size is a numeric value that represents font size measured in points. The default is 11.
color sets the text color.
bcolor, bgcolor, fgcolor, and color may be one of the colors listed in Colors of [RPT] Appendix
for putdocx; a valid RGB value in the form ### ### ###, for example, 171 248 103; or a valid
RRGGBB hex value in the form ######, for example, ABF867.
Output types for tables
The following output types are supported when creating a new table using putdocx table tablename:
(nrows, ncols) creates an empty table with nrows rows and ncols columns. Microsoft Word allows
a maximum of 63 columns in a table.
data(varlist) adds the current Stata dataset in memory as a table to the active document. varlist
contains a list of the variable names from the current dataset in memory.
matrix(matname) adds a matrix called matname as a table to the active document.
mata(matname) adds a Mata matrix called matname as a table to the active document.
etable
(#
1
#
2
. . . #
n
)
adds an automatically generated table to the active document. The table
may be derived from the coefficient table of the last estimation command, from the table of
margins after the last margins command, or from the table of results from one or more models
displayed by estimates table.
If the estimation command outputs n > 1 coefficient tables, the default is to add all tables and
assign the corresponding table names tablename1, tablename2, . . . , tablename
n
. To specify
which tables to add, supply the optional numlist to etable. For example, to add only the
first and third tables from the estimation output, specify etable(1 3). A few estimation
commands do not support the etable output type. See Unsupported estimation commands of
[RPT] Appendix for putdocx for a list of estimation commands that have displayed output that
is not supported by putdocx.

6 putdocx table — Add tables to an Office Open XML (.docx) file
returnset exports a group of Stata return values to a table in the active document. It is intended
primarily for use by programmers and by those who want to do further processing of their
exported results in the active document. returnset may be one of the following:
returnset Description
escalars all ereturned scalars
rscalars all returned scalars
emacros all ereturned macros
rmacros all returned macros
ematrices all ereturned matrices
rmatrices all returned matrices
e* all ereturned scalars, macros, and matrices
r* all returned scalars, macros, and matrices
The following output types are supported when adding content to an existing table using putdocx
table tablename(i, j):
(exp) writes a valid Stata expression to a cell; see [U] 13 Functions and expressions.
image(filename) adds a Portable Network Graphics (.png), Joint Photographic Experts Group
(.jpg), Device-Independent Bitmap (.dib), Enhanced Metafile (.emf), Bitmap (.bmp), Tagged
Image File Format (.tif), or Scalable Vector Graphics (.svg) file to the table cell. If filename
contains spaces, it must be enclosed in double quotes.
table(mem tablename) adds a previously created table, identified by mem tablename, to the
table cell.
The following combinations of tablename(numlist
i
, numlist
j
) (see [U] 11.1.8 numlist for valid
specifications) can be used to format a cell or range of cells in an existing table:
tablename(i, j) specifies the cell on the ith row and jth column.
tablename(i, .) and tablename(numlist
i
, .) specify all cells on the ith row or on the rows
identified by numlist
i
.
tablename(., j) and tablename(., numlist
j
) specify all cells in the jth column or in the columns
identified by numlist
j
.
tablename(., .) specifies the whole table.
Options
Options are presented under the following headings:
table options
cell options
row col options
cell fmt options
exp options
image options
Option for set docx maxtable

putdocx table — Add tables to an Office Open XML (.docx) file 7
table options
memtable specifies that the table be created and held in memory instead of being added to the active
document. By default, the table is added to the document immediately after it is created. This
option is useful if the table is intended to be added to a cell of another table or to be used multiple
times later.
width(#
unit | %
| matname) sets the table width. width(#), width(#unit), or width(#%) may
be specified with width(matname).
width(#
unit | %
) sets the width based on a specified value. # may be an absolute width or a
percentage of the default table width, which is determined by the page width of the document.
For example, width(50%) sets the table width to 50% of the default table width. The default
is width(100%).
When specifying the table width as a percentage, it cannot be greater than 100%.
width(matname) sets the table width based on the dimensions specified in the Stata matrix
matname, which has contents in the form of (#
1
, #
2
, . . . , #
n
) to denote the percentage of the
default table width for each column. n is the number of columns of the table, and the sum of
#
1
to #
n
must be equal to 100.
halign(hvalue) sets the horizontal alignment of the table within the page. hvalue may be left,
right, or center. The default is halign(left).
indent(#
unit
) specifies the table indentation from the left margin of the current document.
layout(layouttype) adjusts the column width of the table. layouttype may be fixed, autofitwindow,
or autofitcontents. fixed means the width is the same for all columns in the table. When
autofitwindow is specified, the column width automatically resizes to fit the window. When
autofitcontents is specified, the table width is determined by the overall table layout al-
gorithm, which automatically resizes the column width to fit the contents. The default is
layout(autofitwindow).
cellmargin(cmarg, #
unit
) sets the cell margins for table cells. cmarg may be top, bottom,
left, or right. This option may be specified multiple times in a single command to accommodate
different margin settings.
cellspacing(#
unit
) sets the spacing between adjacent cells and the edges of the table.
border(bordername
, bpattern
, bcolor
, bwidth
) adds a single border in the location
specified by bordername, which may be start, end, top, bottom, insideH (inside horizontal
borders), insideV (inside vertical borders), or all. Optionally, you may change the pattern, color,
and width for the border by specifying bpattern, bcolor, and bwidth.
This option may be specified multiple times in a single command to accommodate different border
settings. If multiple border() options are specified, they are applied in the order specified from
left to right.
headerrow(#) sets the top # rows to be repeated as header rows at the top of each page on which
the table is displayed. This setting has a visible effect only when the table crosses multiple pages.
varnames specifies that the variable names be included as the first row in the table when the table
is created using the dataset in memory. By default, only the data values are added to the table.
obsno specifies that the observation numbers be included as the first column in the table when the
table is created using the dataset in memory. By default, only the data values are added to the
table.

8 putdocx table — Add tables to an Office Open XML (.docx) file
nformat(% fmt) specifies the numeric format to be applied to the source values when creating the
table from a Stata or Mata matrix. The default is nformat(%12.0g).
rownames specifies that the row names of the Stata matrix be included as the first column in the
table. By default, only the matrix values are added to the table.
colnames specifies that the column names of the Stata matrix be included as the first row in the
table. By default, only the matrix values are added to the table.
title(string
, cell fmt options
) inserts a row without borders above the current table. The added
row spans all the columns of the table and contains string as text. The added row shifts all other
table contents down by one row. You should account for this when referencing table cells in
subsequent commands.
This option may be specified multiple times in a single command to add titles on new lines within
the same cell. Title text is inserted in the order it was specified from left to right. Each title can
be customized using cell fmt options.
note(string
, cell fmt options
) inserts a row without borders to the bottom of the table. The
added row spans all the columns of the table. This option may be specified multiple times in a
single command to add notes on new lines within the same cell. Note that text is inserted in the
order it was specified from left to right. Each note can be customized using cell fmt options.
toheader(hname) specifies that the table be added to the header hname. The table will not be added
to the body of the document.
tofooter(fname) specifies that the table be added to the footer fname. The table will not be added
to the body of the document.
cell options
append specifies that the new content for the cell be appended to the current content of the cell. If
append is not specified, then the current content of the cell is replaced by the new content.
rowspan(#) sets the specified cell to span vertically # cells downward. If the span exceeds the total
number of rows in the table, the span stops at the last row.
colspan(#) sets the specified cell to span horizontally # cells to the right. If the span exceeds the
total number of columns in the table, the span stops at the last column.
span(#
1
, #
2
) sets the specified cell to span #
1
cells downward and span #
2
cells to the right.
linebreak
(#)
specifies that one or # line breaks be added after the text, the image, or the table
within the cell.
row col options
nosplit specifies that row i not split across pages. When a table row is displayed, a page break
may fall within the contents of a cell on the row, causing the contents of that cell to be displayed
across two pages. nosplit prevents this behavior. If the entire row cannot fit on the current page,
the row will be moved to the start of the next page.
addrows(#
, before | after
) adds # rows to the current table before or after row i. If before
is specified, the rows are added before the specified row. By default, rows are added after the
specified row.

putdocx table — Add tables to an Office Open XML (.docx) file 9
addcols(#
, before | after
) adds # columns to the current table to the right or the left of
column j. If before is specified, the columns are added to the left of the specified column. By
default, the columns are added after, or to the right of, the specified column.
drop deletes row i or column j from the table.
width(#
unit | %
) sets the width of column j. # may be an absolute width or a percentage of the
table width. For example, width(50%) sets the column width to take up 50% of the table width.
When specifying the column width as a percentage, it cannot be greater than 100%.
height(#
unit
, atleast | exact
) sets the height of row i.
atleast means the row will have the minimum height of the specified value. This is the default.
exact means the row will have the exact height of the specified value.
cell fmt options
halign(hvalue) sets the horizontal alignment of the specified cell or of all cells in the specified row,
column, or range. hvalue may be left, right, or center. The default is halign(left).
valign(vvalue) sets the vertical alignment of the specified cell or of all cells in the specified row,
column, or range. vvalue may be top, bottom, or center. The default is valign(top).
border(bordername
, bpattern
, bcolor
, bwidth
) adds a single border to the specified
cell or to all cells in the specified row, column, or range in the given location. bordername may
be start, end, top, bottom, or all. Optionally, you may change the pattern, color, and width
for the border by specifying bpattern, bcolor, and bwidth.
This option may be specified multiple times in a single command to accommodate different border
settings. If multiple border() options are specified, they are applied in the order specified from
left to right.
shading(bgcolor
, fgcolor
, fpattern
) sets the background color, foreground color, and fill
pattern for the specified cell or for all cells in the specified row, column, or range.
nformat(% fmt) applies the Stata numeric format % fmt to the text within the specified cell or within
all cells in the specified row, column, or range. This setting only applies when the content of the
cell is a numeric value.
font(fontname
, size
, color
) sets the font, font size, and font color for the current text within
the specified cell or within all cells in the specified row, column, or range. The font size and font
color may be specified individually without specifying fontname. Use font("", size) to specify
font size only. Use font("", "", color) to specify font color only. For both cases, the default
font will be used.
bold applies bold formatting to the current text within the specified cell or within all cells in the
specified row, column, or range.
italic applies italic formatting to the current text within the specified cell or within all cells in the
specified row, column, or range.
script(sub | super) changes the script style of the current text. script(sub) makes the text a
subscript. script(super) makes the text a superscript. script() may only be specified when
formatting a single cell.
strikeout adds a strikeout mark to the current text within the specified cell or within all cells in
the specified row, column, or range.

10 putdocx table — Add tables to an Office Open XML (.docx) file
underline adds an underline to the current text within the specified cell or within all cells in the
specified row, column, or range. By default, a single underline is used. underline(upattern)
can be used to change the format of the line, where upattern may be any of the patterns listed
in Underline patterns of [RPT] Appendix for putdocx. The most common patterns are double,
dash, and none.
allcaps uses capital letters for all letters of the current text within the specified cell or within all
cells in the specified row, column, or range.
smallcaps uses capital letters for all letters of the current text within the specified cell or within all
cells in the specified row, column, or range. smallcaps uses larger capitals for uppercase letters
and smaller capitals for lowercase letters.
exp options
pagenumber specifies that the current page number be appended to the end of the new content for
the cell. pagenumber applies only to tables being added to a header or footer and cannot be
combined with totalpages.
totalpages specifies that the number of total pages be appended to the end of the new content
for the cell. totalpages applies only to tables being added to a header or footer and cannot be
combined with pagenumber.
trim removes the leading and trailing spaces in the expression to be added to the table cell.
hyperlink(link) adds the expression as a hyperlink to the webpage address specified in link.
bookmark(bmname) adds the expression as a bookmark named bmname. You can link to this
bookmark from other text within a paragraph or from an expression in a table cell by using the
bookmarklink(bmname) option.
bookmarklink(bmname) adds the expression as a link to the bookmark named bmname. Note that
bookmark links can point only to bookmarks in the current document. Additionally, these links
cannot point to bookmarks in documents to which you will be appending.
image options
width(#
unit
) sets the width of the image. If the width is larger than the width of the cell, then the
width is used. If width() is not specified, then the default size is used; the default is determined
by the image information and the width of the cell.
height(#
unit
) sets the height of the image. If height() is not specified, then the height of the
image is determined by the width and the aspect ratio of the image.
linebreak
(#)
specifies that one or # line breaks be added after the new image.
link specifies that a link to the image filename be inserted into the document. If the image is linked,
then the referenced file must be present so that the document can display the image.
alt(text) specifies alternative text for the image to be read by voice software.
Option for set docx maxtable
permanently specifies that, in addition to making the change right now, the settings be remembered
and become the default settings when you invoke Stata.
putdocx table — Add tables to an Office Open XML (.docx) file 11
Remarks and examples stata.com
Remarks are presented under the following headings:
Introduction
Creating basic tables
Exporting summary statistics
Exporting estimation results
Creating advanced tables
Customizing headers and footers with tables
Introduction
The suite of putdocx commands makes it easy to export summary statistics, estimation results,
data, and images in neatly formatted tables. There are different output types available to export a
whole coefficient table, matrix, or dataset in a single step. Alternatively, you can create a table by
specifying the dimensions and then gradually inserting contents, such as text, images, and stored
results. When you create a table, you specify a name for it, which allows you to make further
modifications to its contents. You can customize each cell or apply specific formatting to a range of
cells with row and column indexes. The variety of formatting options allows you to export a table
complete with a title, notes, and a repeating header for tables that span multiple pages.
In the following sections, we demonstrate how to create a variety of tables, ranging from small
tables without formatting to more complex, customized tables. In each example, the Word document
we create includes only one table, but the putdocx table commands we use work in the same way
when you insert these tables into a larger document.
Creating basic tables
When exporting only a few statistics and results, you can create a table from scratch—first
specifying the size of the table and then adding content one cell at a time. With this method, it is
easy to control the location of each element within the table.
Example 1: Export a basic table
Suppose we want to export a table with just the mean, minimum, and maximum miles per gallon
for 1978 automobiles to a .docx file. First, we open the dataset and create an active document.
. sysuse auto, clear
. putdocx begin
Now we create our table with the necessary dimensions. We are exporting three statistics that will
appear in one column. We need to allot another column to label these statistics. Therefore, we create
a table named mpgstats with three rows and two columns, and we add a title. By default, the table
width is set at 100%, but because our content is rather short, we set the width to 40% of the default.
Otherwise, the table would take up a large portion of our document and look very empty.
. putdocx table mpgstats = (3,2), title(MPG summary statistics) width(40%)
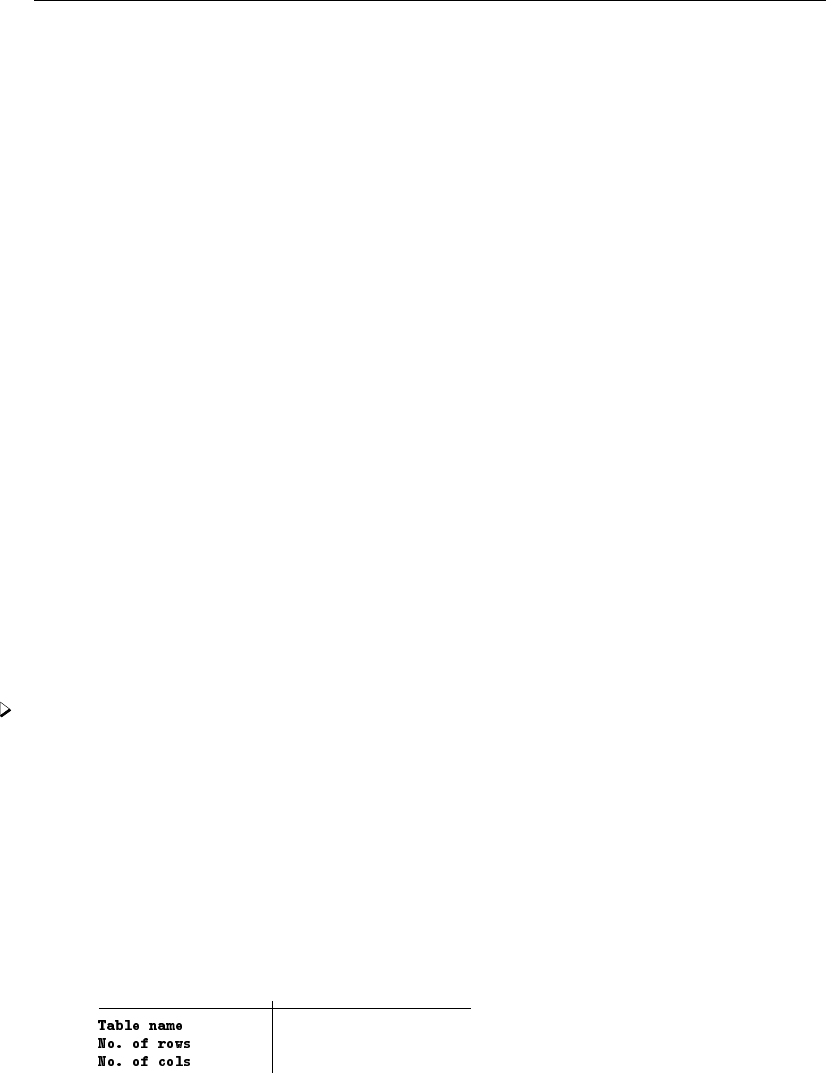
. putdocx describe mpgstats
mpgstats
4
2
When we describe our table, it reports four rows instead of the three we specified. When we add
a title, it is included as the first row of the table without any borders. With our table in place, we
now run summarize mpg and view the list of stored results:
12 putdocx table — Add tables to an Office Open XML (.docx) file
. summarize mpg
Variable Obs Mean Std. dev. Min Max
mpg 74 21.2973 5.785503 12 41
. return list
scalars:
r(N) = 74
r(sum_w) = 74
r(mean) = 21.2972972972973
r(Var) = 33.47204738985561
r(sd) = 5.785503209735141
r(min) = 12
r(max) = 41
r(sum) = 1576
All the statistics we want are stored in rclass scalars. We can directly refer to stored results with
putdocx table. We begin filling in the table by putting the label for the minimum in the second
row and first column, mpgstats(2,1). Then we add the value of the minimum in the cell next to
it, mpgstats(2,2), by referring to the r(min) scalar shown above. Similarly, we add the mean on
row 3 and the maximum on row 4.
. putdocx table mpgstats(2,1) = ("Min.")
. putdocx table mpgstats(2,2) = (r(min))
. putdocx table mpgstats(3,1) = ("Mean")
. putdocx table mpgstats(3,2) = (r(mean)), nformat(%5.2f)
. putdocx table mpgstats(4,1) = ("Max.")
. putdocx table mpgstats(4,2) = (r(max))
. putdocx save example
successfully created "C:/mypath/example.docx"
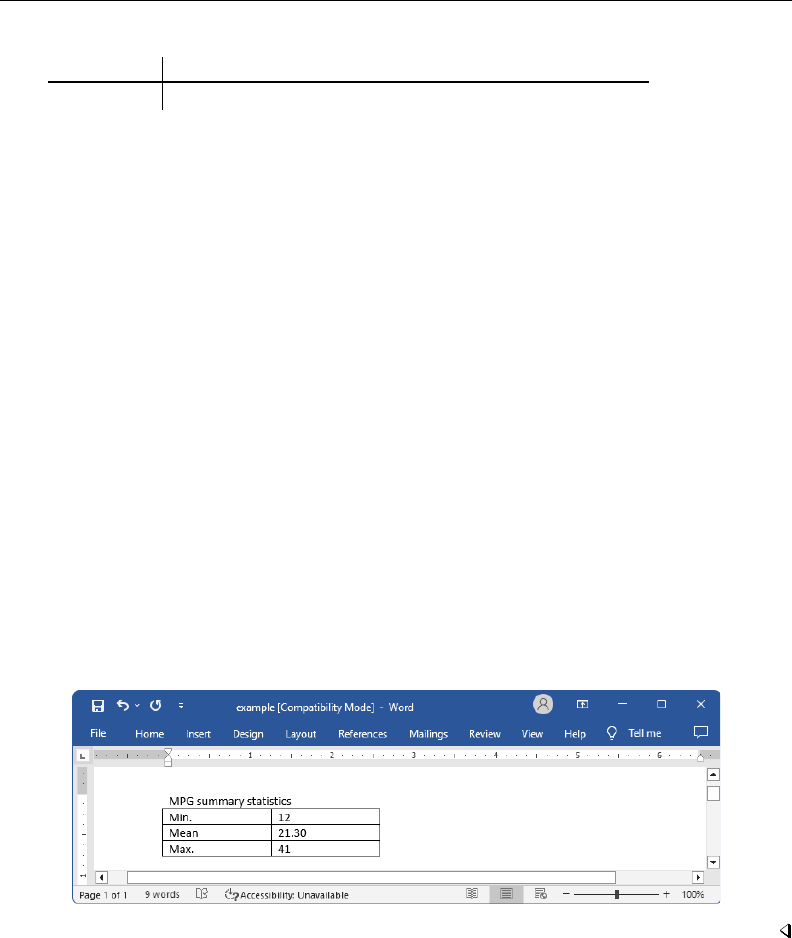
Because the mean of mpg is reported with a lot of accuracy, we specify a numeric formatting.
After saving our work, the example.docx file contains the following:
Exporting summary statistics
In the example above, we exported just a few summary statistics by filling in the content of each
cell in a table. That method would be tedious if we wanted to export several results. Another option
is to create a dataset of summary statistics and export the entire dataset to a table, as shown in the
example below.
putdocx table — Add tables to an Office Open XML (.docx) file 13
Example 2: Export a dataset of summary statistics
Suppose that now we want to report the summary statistics separately for foreign and domestic
automobiles. We create a new active document, and then we use the statsby command to collect
the number of observations along with the minimum, mean, and maximum of mpg for each group.
Because statsby creates a new dataset that overwrites the dataset in memory, we need to preserve
the dataset and then restore it after we have finished exporting the data.
. putdocx begin
. preserve
. statsby Obs=r(N) Min=r(min) Mean=r(mean) Max=r(max), by(foreign):
> summarize mpg
(running on estimation sample)
Command: summarize mpg
Obs: r(N)
Min: r(min)
Mean: r(mean)
Max: r(max)
By: foreign
Statsby groups:
..
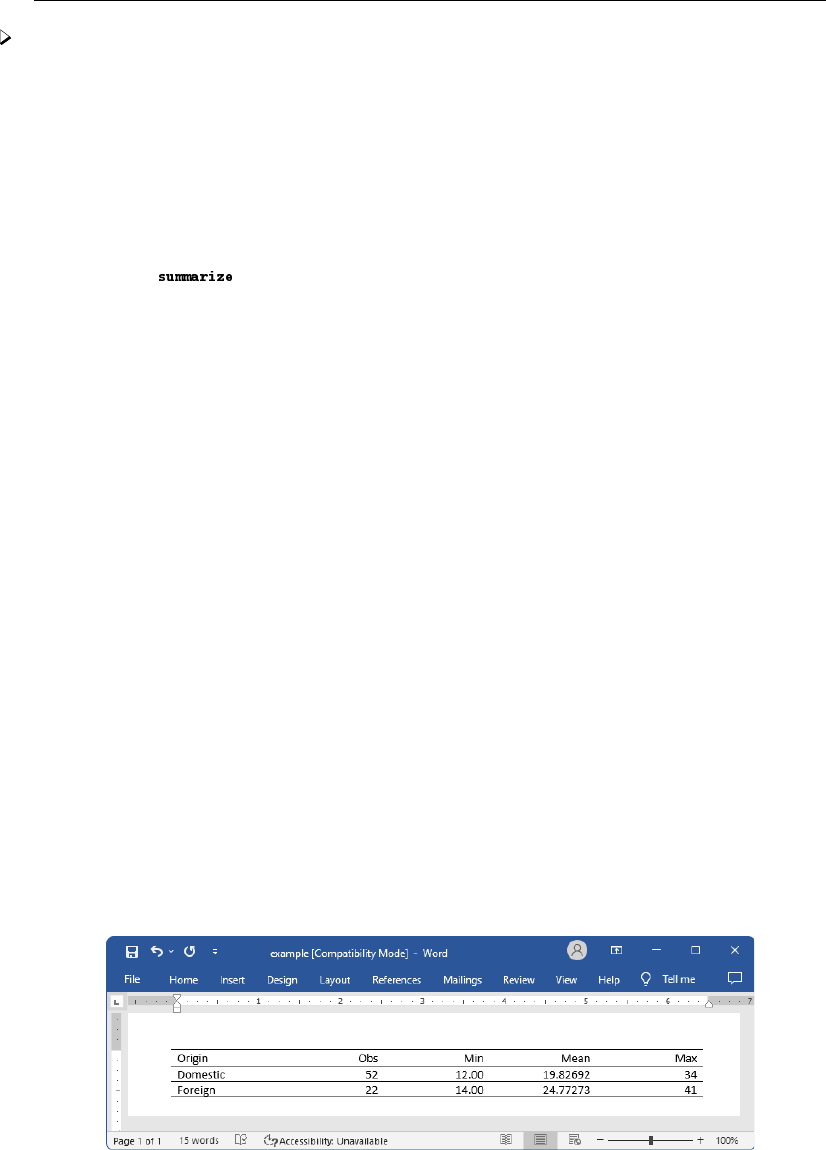
We want the variable names to serve as column titles, so we rename foreign to Origin. Then
we export the data in memory as a table by specifying in data() the variable names Origin, Obs,
Min, Mean, and Max. In this case, we use the table name tbl1. The order of the variable names in
the list determines the column order in the table.
. rename foreign Origin
. putdocx table tbl1 = data("Origin Obs Min Mean Max"), varnames
> border(start, nil) border(insideV, nil) border(end, nil)
By default, the exported table includes single borders around all cells. We use the border()
option to remove all vertical borders from the table.
We further customize the table by setting the text of the cells on the second through the fifth
columns to be right-aligned instead of the default left alignment. To format all the cells in these
columns, we specify the row index as “.” and the column indexes as 2/5 in the (numlist
i
, numlist
j
)
specification for a table. Also, we can choose to display only two digits after the decimal for the
means. For this purpose, we specify a range for the row index of column three.
. putdocx table tbl1(., 2/5), halign(right)
. putdocx table tbl1(2/3, 3), nformat(%5.2f)
. putdocx save example, replace
successfully replaced "C:/mypath/example.docx"
We save our work under the filename example.docx, which contains the following:
14 putdocx table — Add tables to an Office Open XML (.docx) file
Afterward, we restore the dataset.
. restore
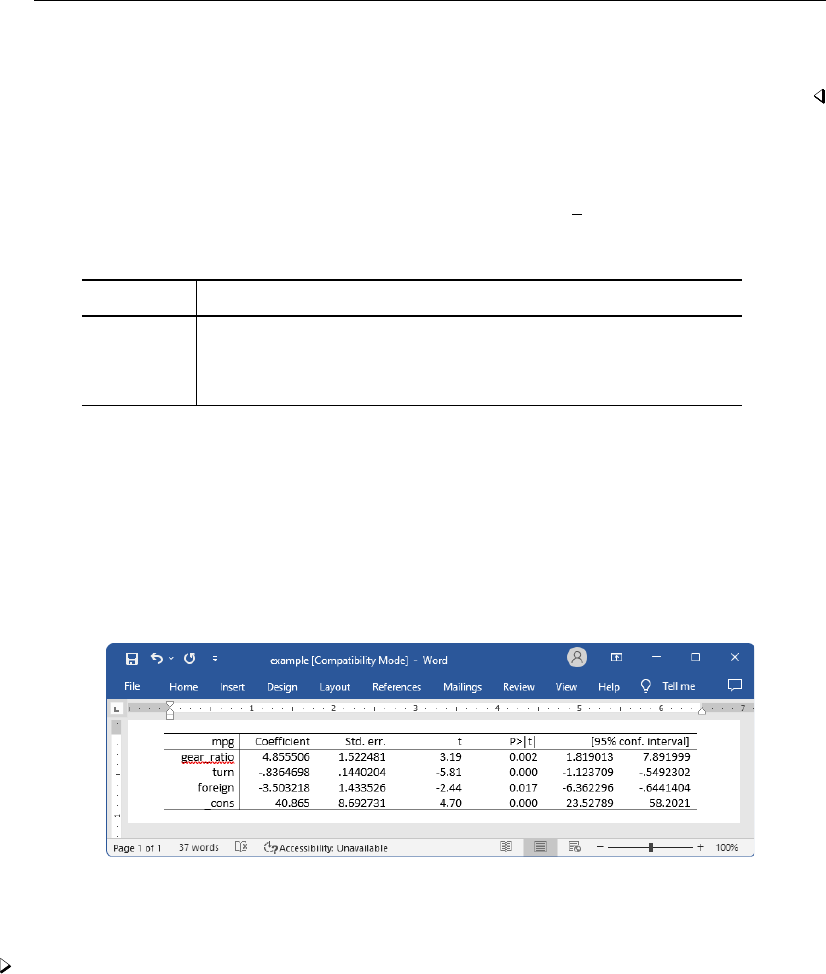
Exporting estimation results
One of the primary uses of putdocx table is to export estimation results. Suppose we fit a linear
regression model of mpg as a function of the car’s gear ratio (gear ratio), turning radius (turn),
and whether the car is of foreign origin (foreign) using regress.
. regress mpg gear_ratio turn foreign, noheader
mpg Coefficient Std. err. t P>|t| [95% conf. interval]
gear_ratio 4.855506 1.522481 3.19 0.002 1.819013 7.891999
turn -.8364698 .1440204 -5.81 0.000 -1.123709 -.5492302
foreign -3.503218 1.433526 -2.44 0.017 -6.362296 -.6441404
_cons 40.865 8.692731 4.70 0.000 23.52789 58.2021
We want to add these regression results to the document. For most estimation commands, we
can use the etable output type to add the elements of the displayed coefficient table with a single
command. As always, we must first create an active document
. putdocx begin
. putdocx table reg = etable
. putdocx save example, replace
successfully replaced "C:/mypath/example.docx"
After saving the document and overwriting our previous work, the table is displayed as follows:
If we instead want to display only a few of the reported statistics, we can customize the table
accordingly. In example 3, we select a subset of the results and format them.
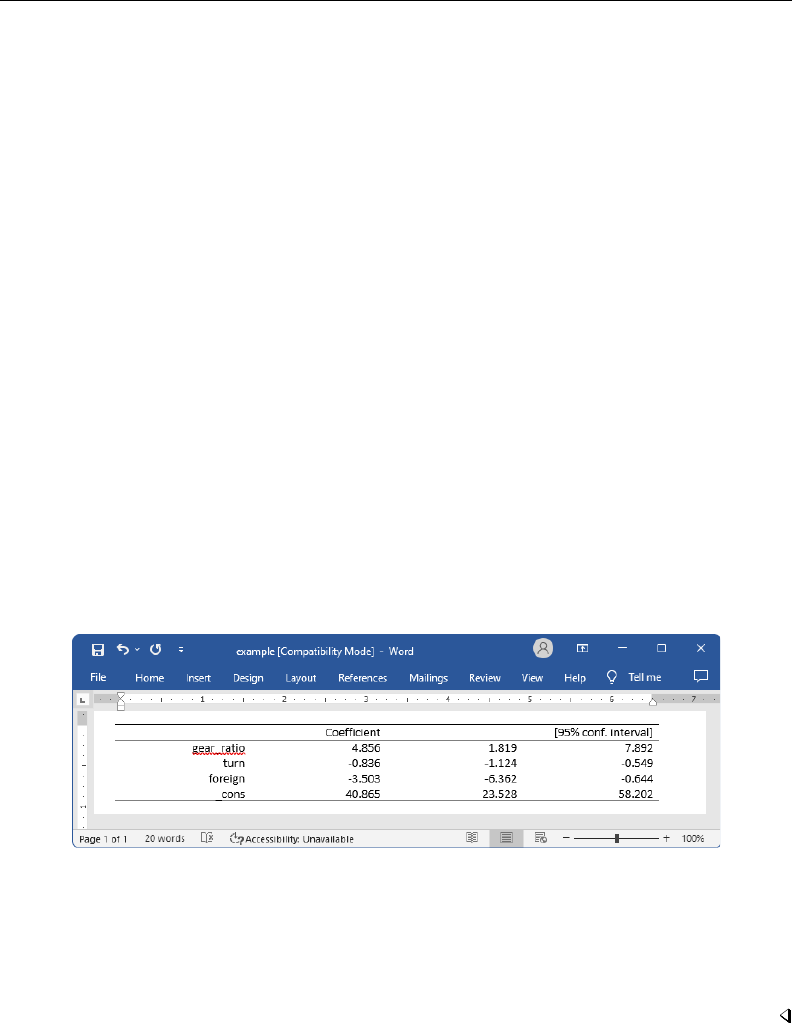
Example 3: Export selected estimation results
Suppose we want to export only the point estimates and confidence intervals from the table above;
we can also use putdocx table to remove the components that we do not want.
putdocx table — Add tables to an Office Open XML (.docx) file 15
First, we create an active document with a table that contains the estimation results from regress,
tbl2. Although the default is for the table to occupy 100% of the width as determined by the
page width of the document, once we drop columns the table width will be adjusted. Therefore, we
specify the width option to ensure that the table occupies the full page width of the document.
Next, we want to remove the third through the fifth columns. To drop the fifth column, we specify
tbl2(.,5) followed by the drop option. We work from right to left, dropping column five before
four, because in this manner, the column numbers to the left of the newly dropped column do not
change. Equivalently, we could have dropped the third column three times, because each time we
drop it, the previous fourth column becomes the third.
Once we have only the desired statistics, we customize the header row by erasing the text “mpg”
from the first column. We then format our table by removing the border on the right side of the
first column. To do this, we specify nil as the border pattern for the right border. And finally, we
format all estimates, in what will now be columns two through four, to have three decimal places by
specifying the column indexes as a range.
. putdocx begin
. putdocx table tbl2 = etable, width(100%)
. putdocx table tbl2(.,5), drop //drop p-value column
. putdocx table tbl2(.,4), drop //drop t column
. putdocx table tbl2(.,3), drop //drop SE column
. putdocx table tbl2(1,1) = ("") // erase the content of first cell "mpg"
. putdocx table tbl2(.,1), border(right, nil)
. putdocx table tbl2(.,2/4), nformat(%9.3f)
. putdocx save example, replace
successfully replaced "C:/mypath/example.docx"
After saving our work, the table appears in the example.docx file as follows:
In this example, because we wanted to use the same number of decimals for all estimates in our
table and because we are using the etable output type, we could have preemptively set the format
with our regress command. The modified version of the command is
. regress mpg gear_ratio turn foreign, noheader cformat(%9.3f)
This avoids the need to issue a separate formatting command.
The etable output type also works after estimates table, and you may find it easier to build
a table of selected estimates prospectively. See example 3 in [R] estimates table for an illustration.

16 putdocx table — Add tables to an Office Open XML (.docx) file
Creating advanced tables
Sometimes, we need to create highly customized tables with complex layouts. putdocx table has
many features that will allow you to create and incorporate sophisticated tables in your documents.
First, we demonstrate how to create a table from a matrix. While this method works with any Stata
matrix, we will demonstrate by using a matrix of stored results from regress. See [U] 14 Matrix
expressions for information on working with Stata matrices.
Exporting a matrix may be helpful when working with one of the few estimation commands that
do not support the etable output type. After running any of these commands, matrices of stored
results can be exported. For a list of estimation commands that do not support the etable output
type, see Unsupported estimation commands of [RPT] Appendix for putdocx.
In the following examples, we demonstrate how to use putdocx table to export tabulation results
and create a customized regression table. These examples demonstrate advanced uses of putdocx
table, which are often helpful. However, for tabulations and regression tables, you can also customize
results using table or collect and export the results to your .docx file using putdocx collect.
See [RPT] putdocx collect for more information on this often simpler solution.
Example 4: Export selected estimation results from a matrix
To illustrate the basic use of matrix manipulation of stored results to create a table, we re-create
the simple estimation table from example 3. The displayed results returned by regress are stored
in the matrix r(table), which can be viewed by typing matrix list r(table).
. matrix list r(table)
r(table)[9,4]
gear_ratio turn foreign _cons
b 4.8555057 -.83646975 -3.5032183 40.864996
se 1.5224812 .14402036 1.4335262 8.6927313
t 3.1892057 -5.8079965 -2.4437769 4.7010537
pvalue .0021348 1.704e-07 .01705791 .00001258
ll 1.8190127 -1.1237093 -6.3622962 23.527891
ul 7.8919987 -.5492302 -.64414044 58.202102
df 70 70 70 70
crit 1.9944371 1.9944371 1.9944371 1.9944371
eform 0 0 0 0
First, we create the matrix rtable as the transpose of r(table) because we want to see the
variable names in rows. The point estimates and confidence intervals in the regression table can be
extracted from the matrix rtable. We can extract columns 1, 5, and 6 from rtable, combine them,
and assign them to another new matrix, r table.
. matrix rtable = r(table)’
. matrix r_table = rtable[1...,1], rtable[1...,5..6]
Then we export r table to a new active document as a table with the name tbl3.
. putdocx begin
. putdocx table tbl3 = matrix(r_table), nformat(%9.3f) rownames colnames
> border(start, nil) border(insideH, nil) border(insideV, nil) border(end, nil)
In this table, all values imported from the matrix have been formatted as %9.3f. In addition, the
row and column names of the matrix r table are included as the first column and first row of the
table. We keep only the top and bottom borders of the table by specifying nil for the leading edge
border (start), trailing edge border (end), inside horizontal edges border (insideH), and inside
vertical edges border (insideV).
putdocx table — Add tables to an Office Open XML (.docx) file 17
The column names from the matrix may not be exactly what we want; we can modify them by
customizing the corresponding cells. We can reset the contents and the horizontal alignment of the
cells on the first row to give the columns new titles.
. putdocx table tbl3(1,2) = ("Coef."), halign(right)
. putdocx table tbl3(1,3) = ("[95% conf. interval]"), halign(right) colspan(2)
Afterward, we add back the bottom border of the first row and right-align the cells on the rest of the
rows by specifying the row range as two through five.
. putdocx table tbl3(1,.), border(bottom)
. putdocx table tbl3(2/5,.), halign(right)
. putdocx save example, replace
successfully replaced "C:/mypath/example.docx"
Our final table will be identical to that shown in example 3.
Example 5: Export tabulation results
For commands that do not support the etable output type, we can use matrices to export the
results. For example, if we want to include a table containing the cross-tabulation of repair records and
car origins in our document, we can export this information from a matrix created by the tabulate
command. To make our table presentable, we begin by adding a value label to the rep78 variable:
. label define repairs 1 "Poor" 2 "Fair" 3 "Average" 4 "Good" 5 "Excellent"
. label values rep78 repairs
Next we tabulate our variables of interest, storing the frequencies in a matrix named repairs,
and create an active document. This matrix does not automatically contain the column totals, so we
add a column at the end of the table and label it accordingly.
. tabulate foreign rep78, matcell(repairs)
Repair record 1978
Car origin Poor Fair Average Good Excellent Total
Domestic 2 8 27 9 2 48
Foreign 0 0 3 9 9 21
Total 2 8 30 18 11 69
. putdocx begin
. putdocx table tbl4 = matrix(repairs), rownames colnames
. putdocx table tbl4(.,6), addcols(1)
. putdocx table tbl4(1,7) = ("Total")
What follows is a loop to fill in the labels we have attached to rep78, as well as the labels for
the car origin. We begin by looping over the two values of foreign, 0 and 1. We use the extended
macro function label to store the labels for each category in the macro ‘rlbl’. Within that loop,
we also loop over the five columns for repair records. To calculate the row totals, we create a macro
freq‘row’ val that points to the frequency of the given cell. We store the cumulative frequencies
in the macro cumul freq‘row’, which is incremented in each run of the loop.
18 putdocx table — Add tables to an Office Open XML (.docx) file
. forvalues i=0/1 {
2. local rlbl: label (foreign) ‘i’
3. local row = ‘i’ + 2
4. putdocx table tbl4(‘row’,1) = (‘"‘rlbl’"’)
5.
. forvalues j=1/5 {
6. local clbl: label (rep78) ‘j’
7. local cstart = ‘j’ + 1
8. putdocx table tbl4(1,‘cstart’) = (‘"‘clbl’"’)
9. local freq‘row’_val = repairs[‘i’+1,‘j’]
10. local cumul_freq‘row’ = ‘cumul_freq‘row’’ + ‘freq‘row’_val’
11. putdocx table tbl4(‘row’,7) = ("‘cumul_freq‘row’’")
12. }
13. }
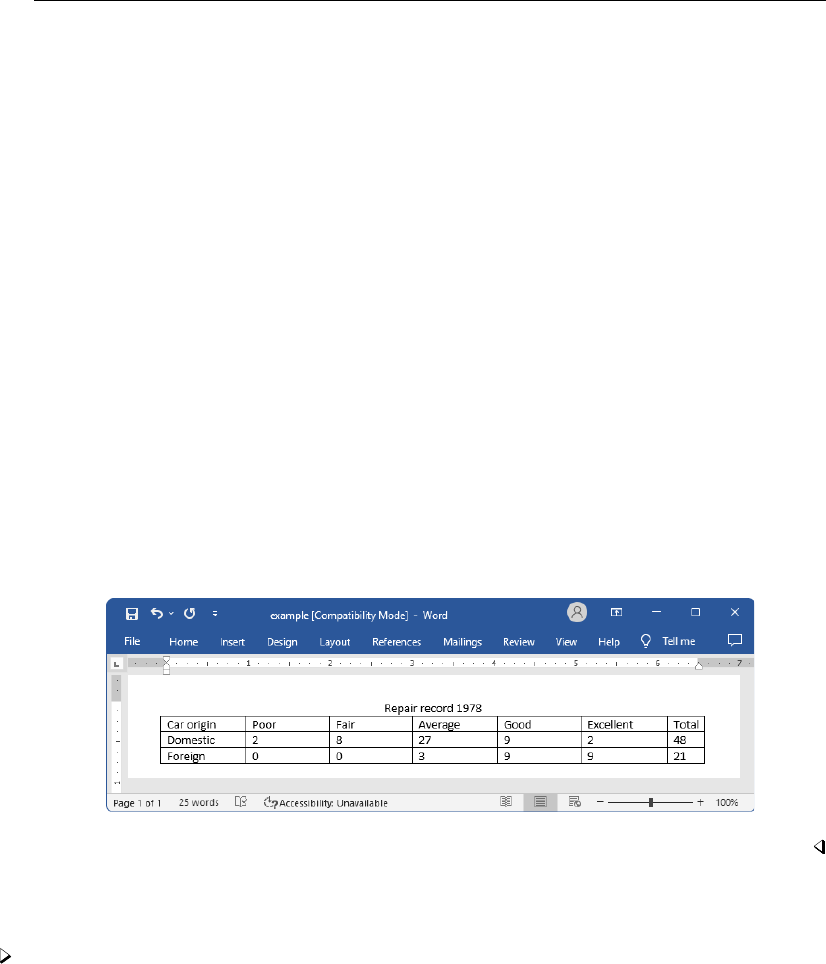
Once all the frequencies have been exported, we insert a row at the top of the table to provide a
title. Additionally, we provide a label for the first column.
. putdocx table tbl4(1,.), addrows(1,before)
. putdocx table tbl4(1,1)= ("Repair record 1978"), colspan(7) halign(center)
> border(left,nil) border(top,nil) border(right,nil)
. putdocx table tbl4(2,1)= ("Car origin")
. putdocx save example, replace
successfully replaced "C:/mypath/example.docx"
We save our work, overwriting the existing content of our document. The table appears in the
example.docx file as follows:
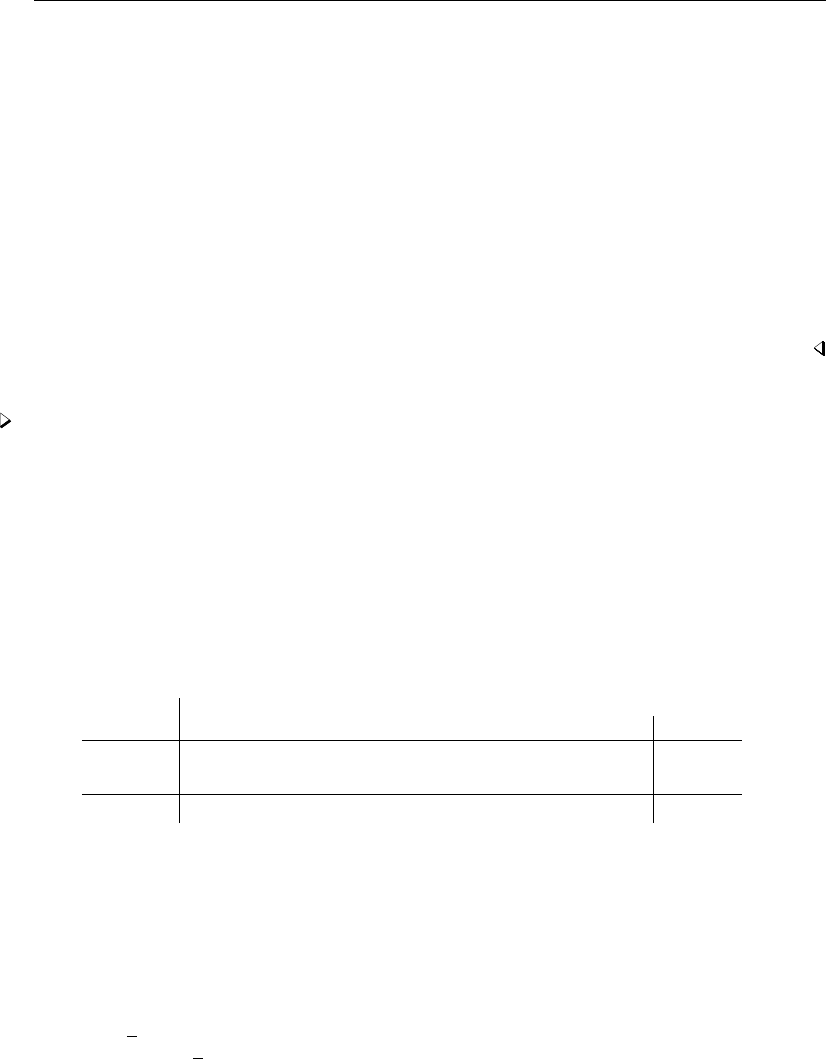
Example 6: Create a table dynamically
In example 3, we created a customized table by dropping the columns we did not want after
exporting the whole coefficient table. You may have another layout in mind, or you may be adding
statistics other than those included in the coefficient table. For these cases, you can create a table
dynamically: start with a simple table, and then add rows or columns to it gradually.
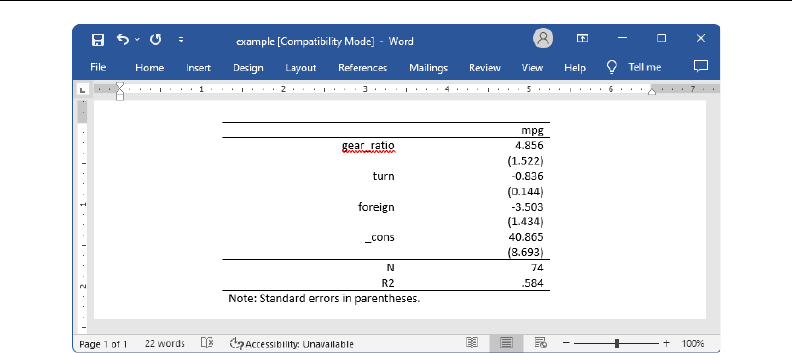
Returning to the regression results from example 3, suppose we want to add an estimation table to
the document containing the point estimates, their standard errors, the total number of observations,
and the coefficient of determination. The estimation table looks like the following:
putdocx table — Add tables to an Office Open XML (.docx) file 19
To create our table of estimation results, we first create an active document. Then we add a 1 × 2
table with no borders and fill the single row with the dependent variable name, mpg. We also set the
table width to be 4 inches and put the table in the center of the document. We add a note stating
that standard errors are in parentheses.
. putdocx begin
. putdocx table tbl5 = (1,2), border(all, nil) width(4) halign(center)
> note(Note: Standard errors in parentheses.)
. putdocx table tbl5(1,1)=("mpg"), halign(right) colspan(2) border(top)
> border(bottom)
Notice that each regressor in the model takes up 2 rows and 2 columns in the table, which means
4 cells. The cell in the first row and first column contains the variable name. The cell in the first
row and second column contains the point estimate. The cell in the second row and second column
contains the standard errors. Based on this logic, we add two rows for each regressor at the end of
the table every time, and we fill in the content and format for each cell one by one.
. local row 1
. local vari 1
. foreach x in gear_ratio turn foreign _cons {
2. putdocx table tbl5(‘row’,.), addrows(2)
3.
. local b: display %9.3f rtable[‘vari’,1]
4. local se: display %9.3f rtable[‘vari’,2]
5. local ++vari
6.
. local ++row
7. putdocx table tbl5(‘row’,1) = ("‘x’"), halign(right)
8. putdocx table tbl5(‘row’,2) = ("‘b’"), halign(right)
9. local ++row
10. local se = strtrim("‘se’")
11. putdocx table tbl5(‘row’,2) = ("(‘se’)"), halign(right)
12. }
Afterward, we add two more rows to the end of the table for the number of observations and the
coefficient of determination.
. putdocx table tbl5(‘row’,.), addrows(2)

20 putdocx table — Add tables to an Office Open XML (.docx) file
We then add each statistic to the table.
. local ++row
. putdocx table tbl5(‘row’,1) = ("N"), border(top) halign(right)
. putdocx table tbl5(‘row’,2) = (e(N)), border(top) halign(right)
. local ++row
. local r2: display %9.3f e(r2)
. putdocx table tbl5(‘row’,1) = ("R2"), halign(right) border(bottom)
. putdocx table tbl5(‘row’,2) = (‘r2’), halign(right) border(bottom)
. putdocx save example, replace
successfully replaced "C:/mypath/example.docx"
We add a bottom border to the last row to separate the note from the rest of the table and save our
work.
Aside from estimation results and summary statistics, you may want to export images to a .docx
file. Images can be exported simply by appending them to an active paragraph, or by inserting them
in a table. The same formatting options are available regardless of how you export an image. For
example, you can specify the height and width dimensions, or include a link to the image. Of course,
when inserting an image in a table, the size is constrained to the dimensions of the given cell. Below,
we include an example of how to insert a series of images within a table, complete with informative
notes.
Example 7: Nesting images in a table
We might want to add various images to the document and align them side by side, row by row, or
both. To be more clear, we use an example to illustrate this purpose. In this example, we use another
dataset—the Second National Health and Nutrition Examination Survey (NHANES II) (McDowell et al.
1981).
First, we fit a three-way full factorial model of systolic blood pressure on age group, sex, and
body mass index (BMI). Then, we estimate the predictive margins for each combination of agegrp
and sex at levels of BMI from 10 through 40 at intervals of 10 and graph the results.
. use https://www.stata-press.com/data/r18/nhanes2, clear
. regress bpsystol agegrp##sex##c.bmi
(output omitted )
. forvalues v=10(10)40 {
2. margins agegrp, over(sex) at(bmi=‘v’)
3. marginsplot
4. graph export bmi‘v’.png
5. }
(output omitted )
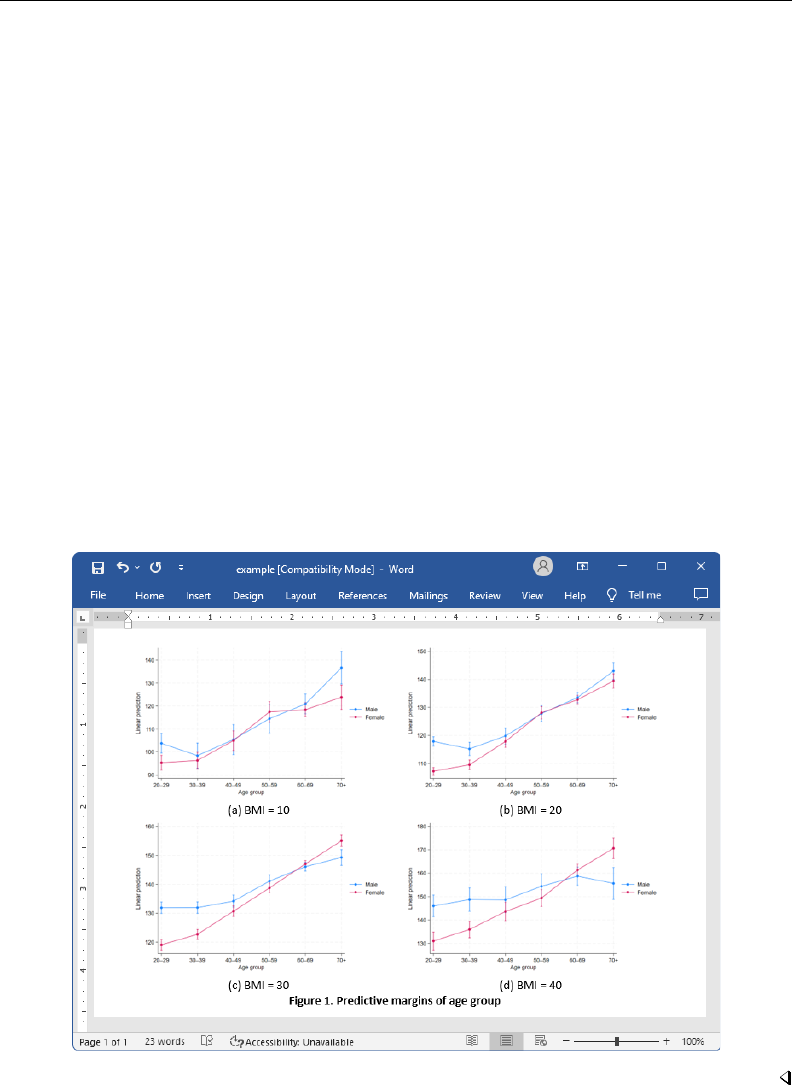
Now, we want to add those four plots into the document, requiring that the margins plots for
bmi=10 and bmi=20 lay side by side on top of the other two side-by-side margins plots for bmi=30
and bmi=40. It is also required that each plot have a subtitle indicating the level of BMI and that the
final figure have a title. This complicated layout can be accomplished using putdocx table.
We create an active document and add a 2 × 2 table. We caption our table by using the note()
option and remove all of its borders for a neater display. In each cell, we add a plot and then append
center-aligned text to it.
putdocx table — Add tables to an Office Open XML (.docx) file 21
. putdocx begin
. putdocx table tbl6 = (2,2), border(all,nil)
> note(Figure 1. Predictive margins of age group) halign(center)
. putdocx table tbl6(1,1)=image(bmi10.png)
. putdocx table tbl6(1,1)=("(a) BMI = 10"), append halign(center)
. putdocx table tbl6(1,2)=image(bmi20.png)
. putdocx table tbl6(1,2)=("(b) BMI = 20"), append halign(center)
. putdocx table tbl6(2,1)=image(bmi30.png)
. putdocx table tbl6(2,1)=("(c) BMI = 30"), append halign(center)
. putdocx table tbl6(2,2)=image(bmi40.png)
. putdocx table tbl6(2,2)=("(d) BMI = 40"), append halign(center)
We formatted our table and the cell contents as we added content to the document. However, we
would also like to format the caption. The note() option adds an additional row at the end of the
table that spans all the columns of the table. We can format the text of the note by specifying the
last row (in this case, 3) and either . or 1 as the column index. Here, we center-align and bold the
text of the caption. Because note text is always placed within a single merged cell, it does not matter
how short or long the text is when you identify the cell location.
. putdocx table tbl6(3,.), halign(center) bold
. putdocx save example, replace
successfully replaced "C:/mypath/example.docx"
After saving our work to example.docx, the table is displayed as follows:
22 putdocx table — Add tables to an Office Open XML (.docx) file
Technical note
When you add a .svg file to a .docx file using putdocx, an extra .png file is generated using
the original .svg file and embedded in the .docx file. This .png file is used to render the original
.svg file in viewers that do not support rendering .svg files.
Customizing headers and footers with tables
Tables are a great way to organize summary statistics and estimation results, but they can also be
used to customize the content of a header or footer. For example, you can create a table with a title
or logo in one column and page numbers in another. Simply use the header() or footer() options
to place the table content in either the header or the footer of the document.
Example 8: Customize header content with a table
Suppose that we are creating a progress report for the nearby community college that tracks the
number of enrollees and their grade point averages. To better organize ourselves, we want to include
the semester in the header of our report. Additionally, we want to include the page number and the
total page count. We can include all this content in the header of our report by placing it in a table.
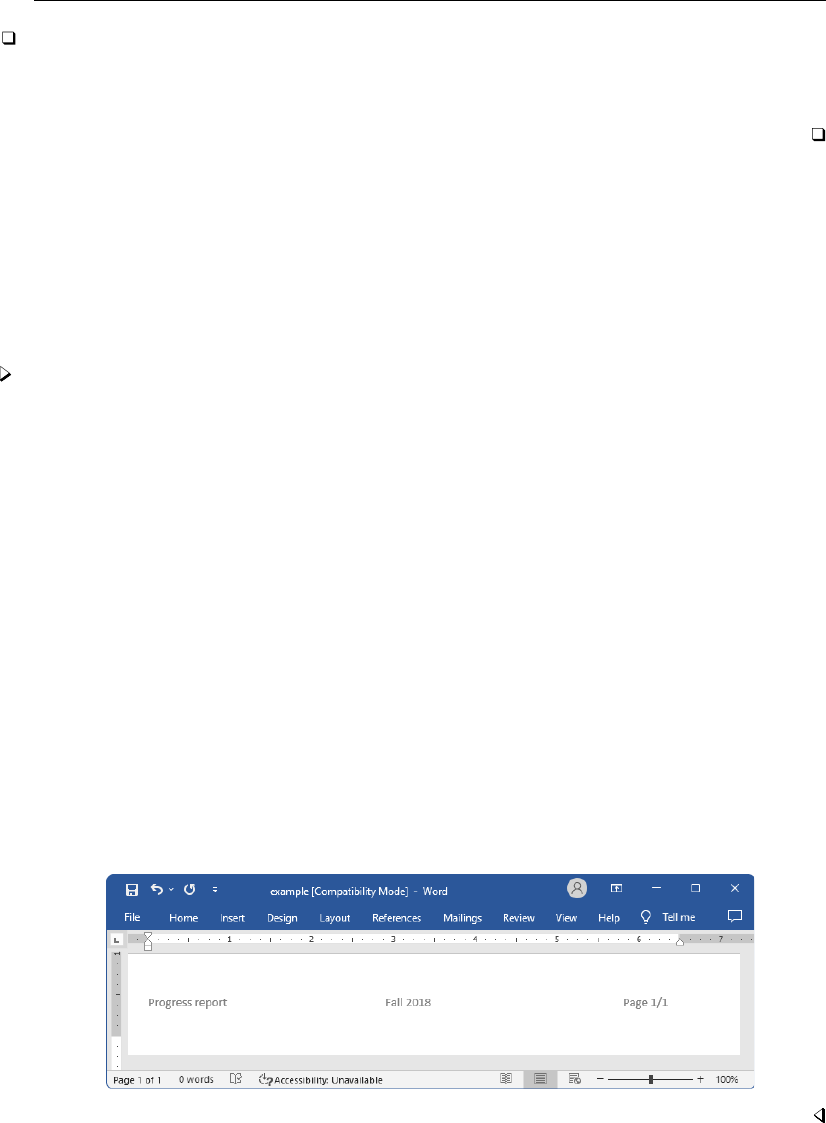
We add a blank header to our document by specifying the header option with putdocx begin.
Then we can add the table contents to the header by specifying the toheader() option. We place
our report title in the first column, the semester in the center column, and the page numbers in the
last column. We first list the current pagenumber, and we then append a forward slash followed by
the total page count.
. putdocx begin, header(fall_report)
. putdocx table hdr = (1, 3), border(all, nil) toheader(fall_report)
. putdocx table hdr(1, 1) = ("Progress report")
. putdocx table hdr(1, 2) = ("Fall 2018"), halign(center)
. putdocx table hdr(1, 3) = ("Page "), pagenumber
. putdocx table hdr(1, 3) = ("/"), totalpages append
. putdocx table hdr(1, 3), halign(right)
. putdocx save example, replace
successfully replaced "C:/mypath/example.docx"
After saving the document, it contains the following:

putdocx table — Add tables to an Office Open XML (.docx) file 23
Stored results
putdocx describe tablename stores the following in r():
Scalars
r(nrows) number of rows in the table
r(ncols) number of columns in the table
Reference
McDowell, A., A. Engel, J. T. Massey, and K. Maurer. 1981. Plan and operation of the Second National Health and
Nutrition Examination Survey, 1976–1980. Vital and Health Statistics 1(15): 1–144.
Also see
[RPT] putdocx intro — Introduction to generating Office Open XML (.docx) files
[RPT] putdocx begin — Create an Office Open XML (.docx) file
[RPT] putdocx collect — Add a table from a collection to an Office Open XML (.docx) file
[RPT] putdocx pagebreak — Add breaks to an Office Open XML (.docx) file
[RPT] putdocx paragraph — Add text or images to an Office Open XML (.docx) file
[RPT] Appendix for putdocx — Appendix for putdocx entries
Stata, Stata Press, and Mata are registered trademarks of StataCorp LLC. Stata and
Stata Press are registered trademarks with the World Intellectual Property Organization
of the United Nations. StataNow and NetCourseNow are trademarks of StataCorp
LLC. Other brand and product names are registered trademarks or trademarks of their
respective companies. Copyright
c
1985–2023 StataCorp LLC, College Station, TX,
USA. All rights reserved.
®
For suggested citations, see the FAQ on citing Stata documentation.
