
Mexico
Real Estate Outlook
Second half 2020

Mexico Real Estate Outlook. Second half 2020 2
Contents
1. Summary .......................................................................................................... 3
2. Market Conditions ............................................................................................ 4
2a. Recovery of the sector could take years ....................................................................... 4
2b. The mortgage cycle faces the worst crisis .................................................................. 14
3. Special Topics ................................................................................................ 23
3a. SMEs play an increasingly important role in construction ........................................... 23
3b. The structural dynamics of housing prices in Mexico .................................................. 29
4. Statistical Annex ............................................................................................. 37
5. Special topics included in previous issues ...................................................... 41
Closing date: September 25, 2020

Mexico Real Estate Outlook. Second half 2020 3
1. Summary
We are currently in the midst of the worst economic crisis that Mexico has experienced in modern times. This has resulted
in the sharpest declines in history and deeper impacts than those seen in 1995. Construction is not exempt, and the
economic depression that the sector has been experiencing since 2018 has worsened. Although rates are not currently
at their lowest—1995 saw a contraction of more than 40%—we are experiencing the longest recorded period of negative
results. Recovery is still a long way off, given that there is no favorable outlook for its main components—building and
civil engineering—in the short term. Financing to this sector has risen marginally, up 4% in real terms from 1Q19 to 2Q20.
However, this higher demand for credit is associated more with the need to maintain liquidity than with an increase in
economic activity.
In a similar sense, lending in the mortgage market is down almost 15% in real terms. This result is mostly due to
commercial banking, as public institutions have been in decline since last year. By segment, demand for mid-range
housing is now also slowing, as it has done for several years, to fall behind social housing demand. Only residential and
residential plus housing have seen an improvement so far in 2020, suggesting that these segments are primarily driven
by investment rather than the need to meet housing requirements. This was probably the final boost to demand.
Moreover, supply was also curbed by the restrictions imposed in response to the health emergency, which helped to
prevent a widespread over-supply and thus maintain appreciation. As we have seen on previous occasions, demand will
pick up again to stimulate the creation of formal private employment with greater purchasing power. On this occasion, a
combination of economic and health-related certainties will be essential for a return to growth in this market.
Within construction, one type of company particularly stands out during this period of economic contraction. From 2014
to 2019, SMEs have steadily increased their number of units, but their value added within the sector has increased even
more so. This could be the result of the lower scales required in a smaller sector that focuses more on specific projects
than on mass developments. It could also be explained by the segmentation of construction processes in major works.
However, much remains to be done in order to consolidate these companies, which are the main source of employment
for the sector and the economy as a whole. Reliability and access to formal financing will be paramount to these
companies maintaining their good progress. SMEs are a pillar to the sector and are key in getting back on track toward
growth.
We conclude this edition of Mexico Real Estate Outlook with a more formal review of housing price dynamics. In times
of economic crisis, doubts always arise surrounding the valuation of these assets, as does the fear that they will
depreciate. Demand factors have a greater impact on the outcome of appreciation rates both structurally and in the long
term. However, supply has a negative or positive effect depending on whether or not it is synchronized with effective
demand. Some aspects have changed over the years, such as the effect of housing subsidies that bolstered demand for
the social housing segment. As such, the weight of formal employment, access to mortgage loans and confidence will
be the factors that dictate housing price dynamics. In any case, we believe that, despite the slowdown in appreciation,
housing will continue to be an attractive long-term investment.
Mexico Real Estate Outlook. Second half 2020 4
2. Market Conditions
2a. Recovery of the sector could take years
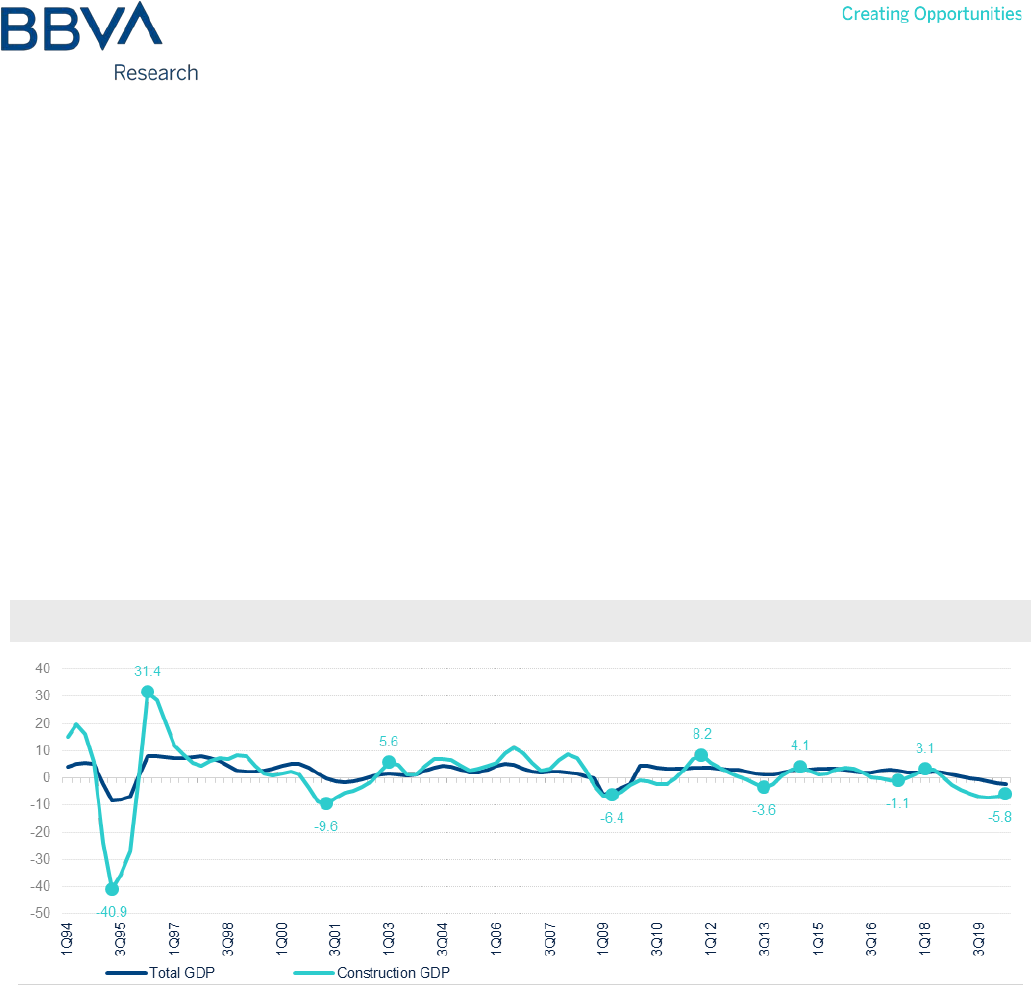
Faced with the sector's longest-lasting depression
In the previous edition of Mexico Real Estate Outlook, we estimated that 2020 would be an even more difficult year
for construction, however we never anticipated such an adverse scenario. The health emergency has driven the sector
into an unprecedented economic crisis, which has deepened the construction depression and prolonged its duration.
Although rates are not at their lowest—1995 saw the sector's GDP fall by up to 40%—it is likely that construction will
remain stagnant for the longest period on record.
Figure 2a.1 TOTAL GDP AND CONSTRUCTION GDP, CYCLICAL TREND (YoY % CHANGE)
Source: BBVA Research based on SCNM and INEGI data
One reason why we are not seeing the lowest rates during the second quarter of 2020 (2Q20), as we have in other
sectors, is because construction already began its decline at the end of 2018. The construction sector has now been in
contraction for a total of seven quarters, close to the ten observed during the 2009 crisis if we consider the cyclical
trend series. Taking into account the original series, there have now been eight quarters of negative results, making it
the longest period of contraction since 2001. In 2008, construction GDP had reached an all-time peak of MXN 1.228
billion, a figure that was not reached again until 2012 when the year's GDP totaled MXN 1.234 billion. Despite only
recording two and a half years of negative rates, recovery therefore took four years. In 2018, the sector's GDP reached
a record high of MXN 1.299 billion, while the average GDP at 2Q20 stands at MXN 1.169 billion. All these figures are
based on the cyclical trend series for construction GDP.
Mexico Real Estate Outlook. Second half 2020 5
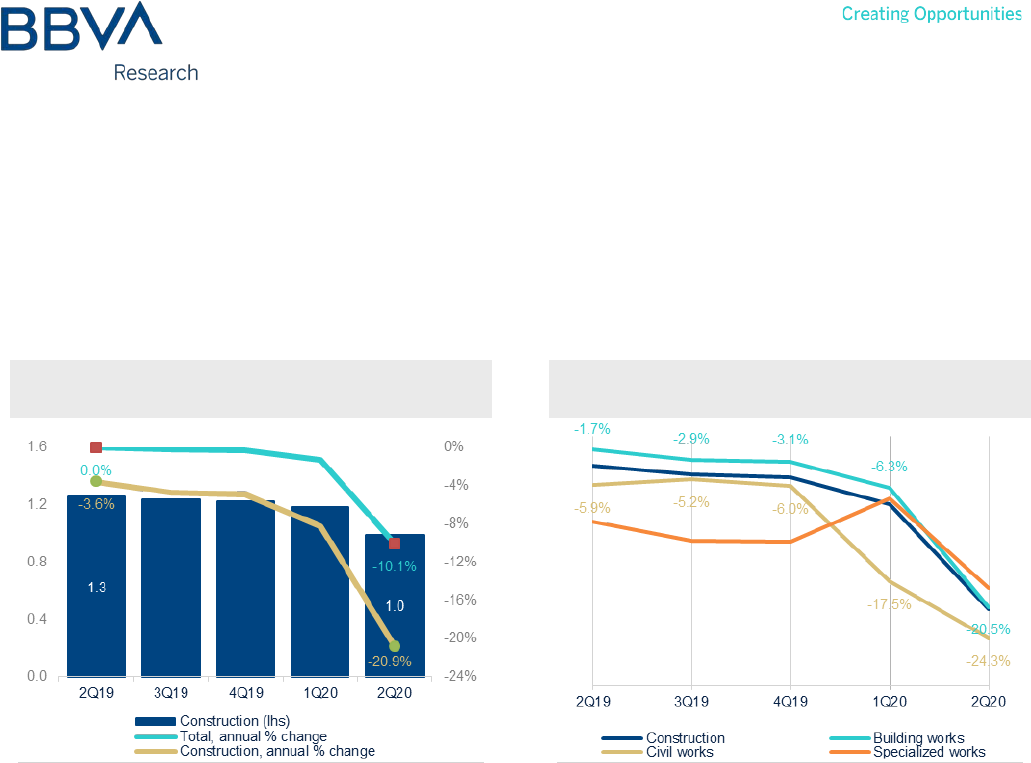
In the current cyclical context, construction GDP, in its original series, saw an acceleration in its rate of decline during
the first two quarters of 2020. In 1Q20, the change was -8.2% and in 2Q20 it contracted by a total of 20.9% to reach
MXN 993 billion. The last time that the sector recorded GDP of less than a trillion pesos was in 2003. This result is a
combination of negative changes in each of the three sub-sectors. As in previous years, this result is led by civil
engineering, followed by building and specialized works, although the share of the latter is very small.
Figure 2a.2 CUMULATIVE CONSTRUCTION GDP
(MXN BILLIONS AND YoY % CHANGE)
Figure 2a.3 CUMULATIVE CONSTRUCTION GDP
(YoY % CHANGE)
Source: BBVA Research based on SCNM and INEGI data
Source: BBVA Research based on SCNM and INEGI data
Civil engineering continues to contract as a result of lower investment. The public sector tends to have a larger share in
this area as it involves infrastructure works, although the private sector share did experience growth. The decline in
building also saw a sharper downturn in light of reduced demand across the board for this type of work.
Lower investment in infrastructure and lower demand for building works have led to adjusted supply and reduced
projects. This would imply that, due to its output factors, demand would follow the same trajectory. However, given that
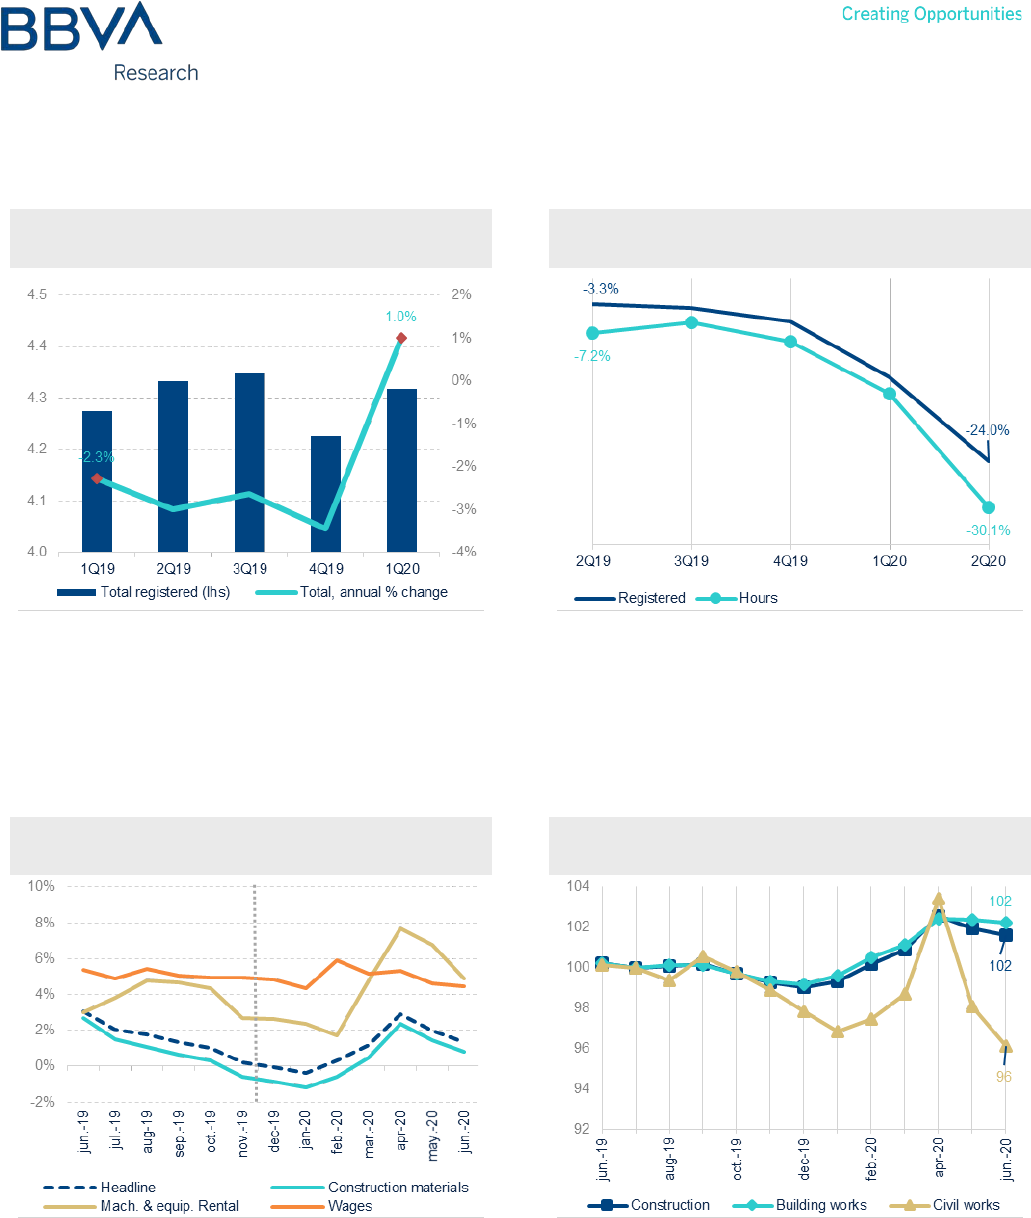
the sector is labor intensive, there may also be a substitution effect between said factors. This is probably what we are
seeing now that the number of workers in the sector reached 4.3 million in 1Q20, the latest figure reported by the
INEGI (Instituto Nacional de Estadística y Geografía — National Statistics and Geographical Institute). This number
represents growth of 1%. The maximum number of jobs in the sector was 4.5 million in mid-2018, when the decline had
already begun.
As we mentioned earlier, predicting changes in labor demand in this sector during economic slumps may be vague
given the substitution effect between factors. However, construction is one of the sectors that generates the most
employment, as it requires fewer qualifications. A such, it can be a safe haven for employment, thereby highlighting its
vital role in economic revival. In other words, increased investment in this sector would help the rest of the economy
through the recovery of employment and, in turn, consumption. On the contrary, labor productivity, measured by the
number of workers and the number of hours, continues to decline. This result is to be expected as the number of
employees remains the same, but output falls.
Mexico Real Estate Outlook. Second half 2020 6
Figure 2a.4 CONSTRUCTION EMPLOYEES
(MILLIONS OF WORKERS)
Figure 2a.5 LABOR PRODUCTIVITY
(YoY % CHANGE)
Source: BBVA Research based on INEGI ENOE data
Source: BBVA Research based on INEGI data
The inflation faced by builders remains under control. While there was a slight rebound in April, driven by higher costs
in machinery rental and to a lesser extent by materials, the appreciation of inputs remains below the 3% bar. In the
past year, prices for renting machinery and construction equipment have been rising higher than other components. In
2Q20, the cost of this particular input remained above 5%, although we expect it to ease during the second half of the
year.
Figure 2a.6 CONSTRUCTION INPUTS INPP
(YoY % CHANGE)
Figure 2a.7 CONSTRUCTION INPP
(2019 INDEX = 100)
Source: BBVA Research based on INEGI data
Source: BBVA Research based on INEGI data
Mexico Real Estate Outlook. Second half 2020 7
The main reason behind this increase is the appreciation of the exchange rate with a slight lag, and not so much due to
greater demand associated with the increase in construction works. The exchange rate is a determining factor in the
rental of machinery and equipment as the exchange terms are usually defined in dollars. However, construction
material prices are stabilizing as demand drops due to reduced activity. We believe that this dynamic will continue until
the sector resumes its growth trend and suppliers in the sector can increase prices. All of the above is under the
assumption that no supply shock will arise in the manufacture of these inputs. Finally, remuneration also remains
stable, with minimum wage increases being the changes most reflected in this aspect.
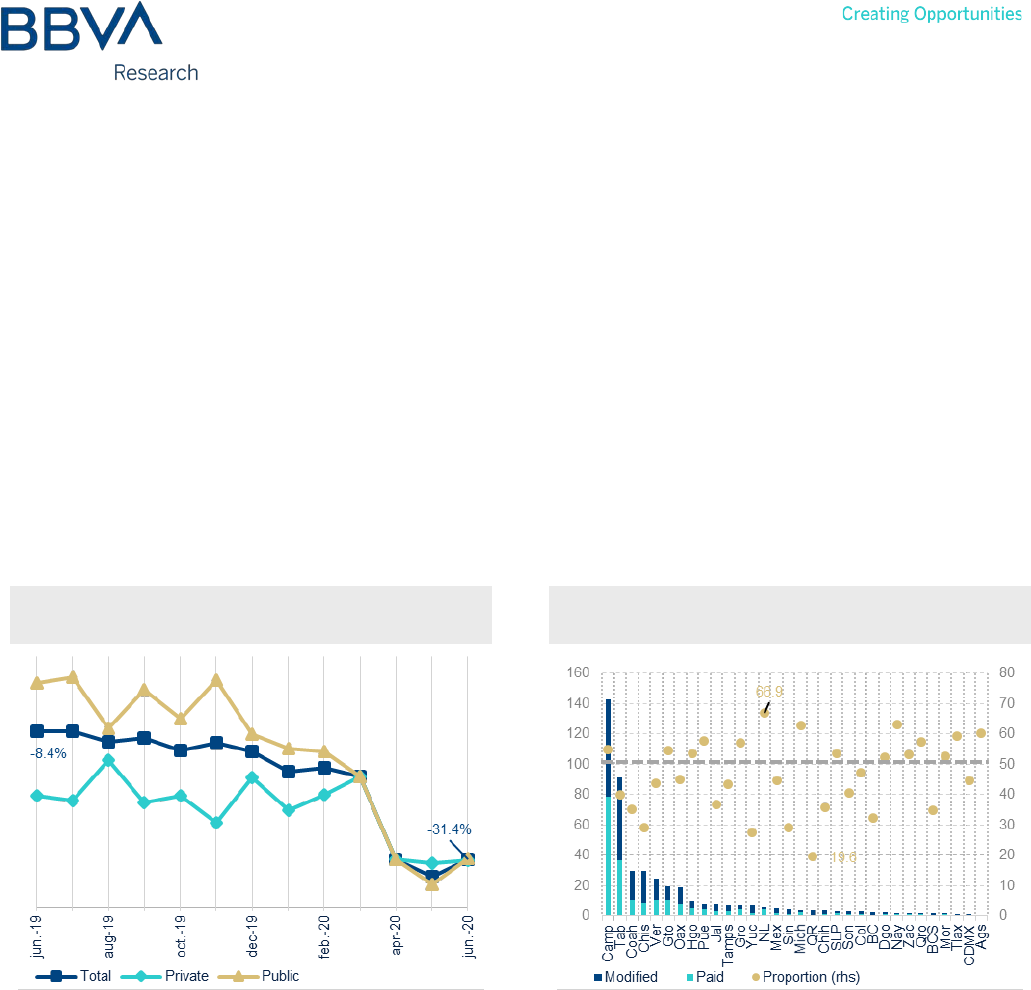
As was the case for many other economic activities, the gross value of construction, calculated in annual terms,
plunged during 2Q20 as a result of the lockdown in response to the health emergency. The change recorded for each
of the months in this quarter was -31.5%, -34.6% and -31.4% respectively. Unlike the previous year, so far in 2020, the
declines in the public and private spheres have been very similar, given that operations ceased for both. Once
restrictions were lifted in June, slight progress can be seen in monthly terms; however, the negative trend persists in
the annual comparison.
Figure 2a.8 GROSS VALUE OF CONSTRUCTION
(YoY % CHANGE)
Figure 2a.9 2020 PEF EXPENDITURE ON PUBLIC
WORKS (MXN BILLIONS AND %)
Source: BBVA Research based on INEGI ENEC data
Source: BBVA Research based on SHCP data
According to the progress of the public works reported by the Ministry of Finance and Public Credit, 46.2% of the
modified budget based on the 2020 Federal Budget had been paid out half way through the year. The entities with the
highest budget for this type of work are those in the states of Campeche and Tabasco, thanks to the investment in
infrastructure for hydrocarbon-based energy. However, Nuevo León, Nayarit and Michoacán have seen the greatest
progress, above 60%; leaving Quintana Roo last at only 20%. These figures indicate that there has been no significant
lag in the budget that can be attributed to reduced activity. However, the approved budget already represented less
investment.
Mexico Real Estate Outlook. Second half 2020 8
Severe contractions in the value of construction in both building and civil engineering confirm the result observed in the
sector's GDP. As discussed, reduced demand for both building and infrastructure has resulted in lower output. Despite
this, the value of building remained above MXN 12 billion during 1Q20, but by the next quarter it had already fallen
below MXN 10 billion. Output around this figure has not been seen since this data was first recorded (2006); in 2018
alone the monthly average was just over MXN 15 billion.
Figure 2a.10 BUILDING GROSS VALUE
(MXN BILLIONS AND YoY % CHANGE)
Figure 2a.11 INFRASTRUCTURE GROSS VALUE
(MXN BILLIONS AND YoY % CHANGE)
Source: BBVA Research based on INEGI ENEC data
Source: BBVA Research based on INEGI ENEC data
Furthermore, the value of civil engineering output has been in decline for a longer period of time. At present, just over
MXN 8 billion is yielded, a figure not previously recorded according to the ENEC (Encuesta Nacional de Empresas
Constructoras — National Survey of Construction Companies) which is conducted and published by INEGI. As a
reference point, the average monthly output in 2018 was over MXN 13 billion and just over MXN 12 billion in 2019. By
the beginning of 2020, however, it had already fallen below MXN 10 billion. This result was to be expected in light of
lower public and private investment.
Activity in decline, bank credit on the rise
In light of reduced activity, and the associated investment, reduced need for financing was only to be expected.
However, different behaviors often emerge in atypical times. This dynamic was confirmed during 2019 by lower
demand for credit, despite the fact that the cost of funding was already falling as a result of the change in monetary
policy. As if we had seen a certain "liquidity trap," the lower reference rate failed to boost demand for resources and
thus boost activity, at least in the construction sector. The story changes at the beginning of 2020 when the balance of
the sector's credit portfolio rose from MXN 603 billion to MXN 642 billion in 1Q20, to reach MXN 658 billion even during
2Q20. We attribute this increase in the sectoral portfolio to construction companies' need for liquidity, partly driven by
the lower cost of such credit due to repeated reductions in the reference rate and the support programs designed by
the financial authorities and the banking system.
Mexico Real Estate Outlook. Second half 2020 9
Figure 2a.12 CONSTRUCTION CREDIT BALANCE
(MXN BILLIONS AND %)
Figure 2a.13 BANK CREDIT PENETRATION
(% SHARE AND YoY % CHANGE)
Source: BBVA Research based on Bank of Mexico data
Source: BBVA Research based on INEGI and Bank of Mexico data
One effect of the situation described in the previous paragraph is increased bank credit penetration in construction
relative to its GDP. This factor saw a decline throughout 2019, but after a turning point in 2020, it has begun to rise,
reaching 66%. In any case, this level is due not only to the increase in credit directed to the sector, but also to lower
GDP.
Figure 2a.14 CONSTRUCTION CREDIT BALANCE
(MXN BILLIONS)
Figure 2a.15 CONSTRUCTION CREDIT BALANCE
(YoY % CHANGE)
Source: BBVA Research based on Bank of Mexico data
Source: BBVA Research based on Bank of Mexico data
Mexico Real Estate Outlook. Second half 2020 10
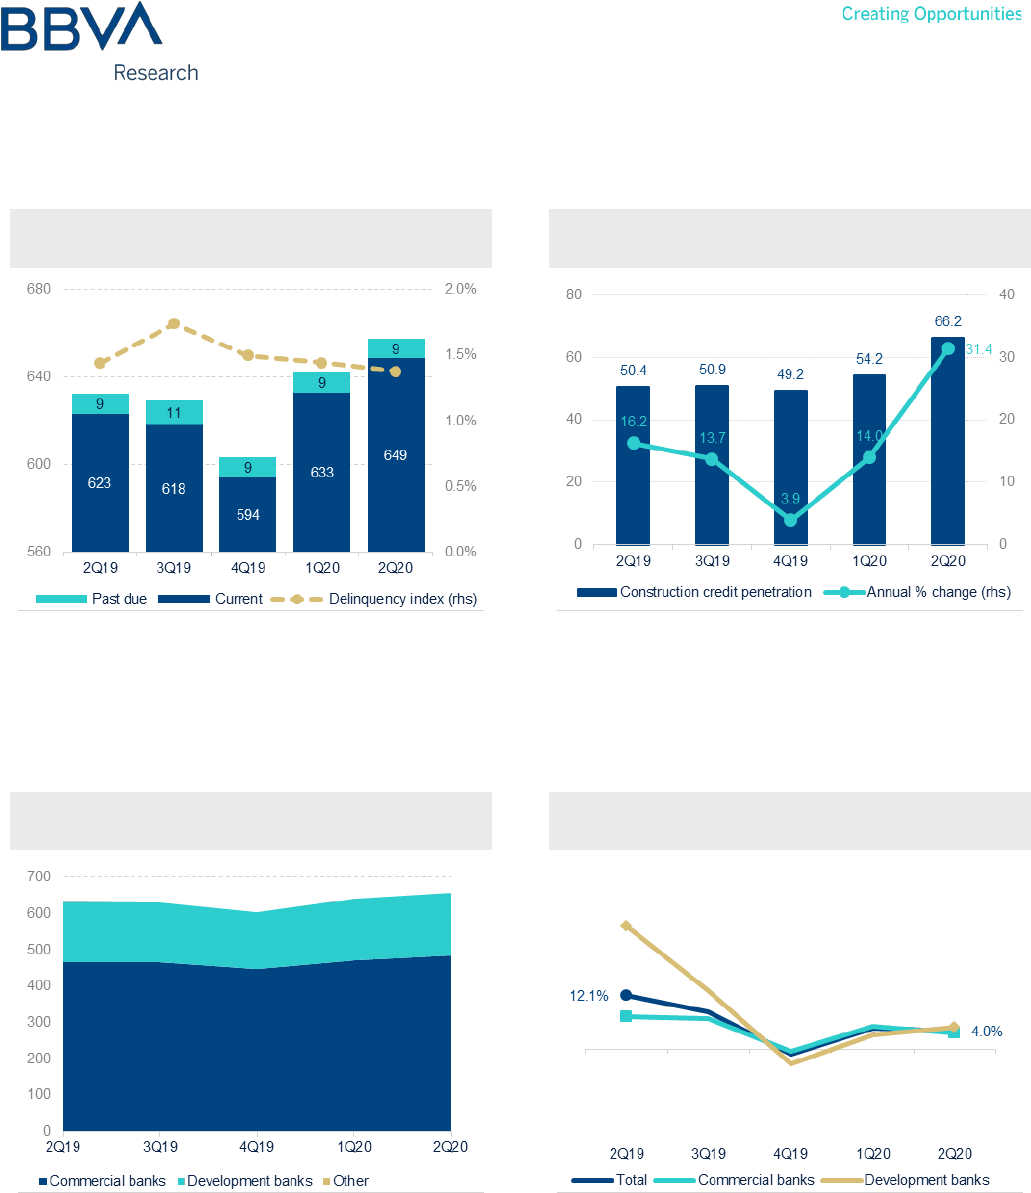
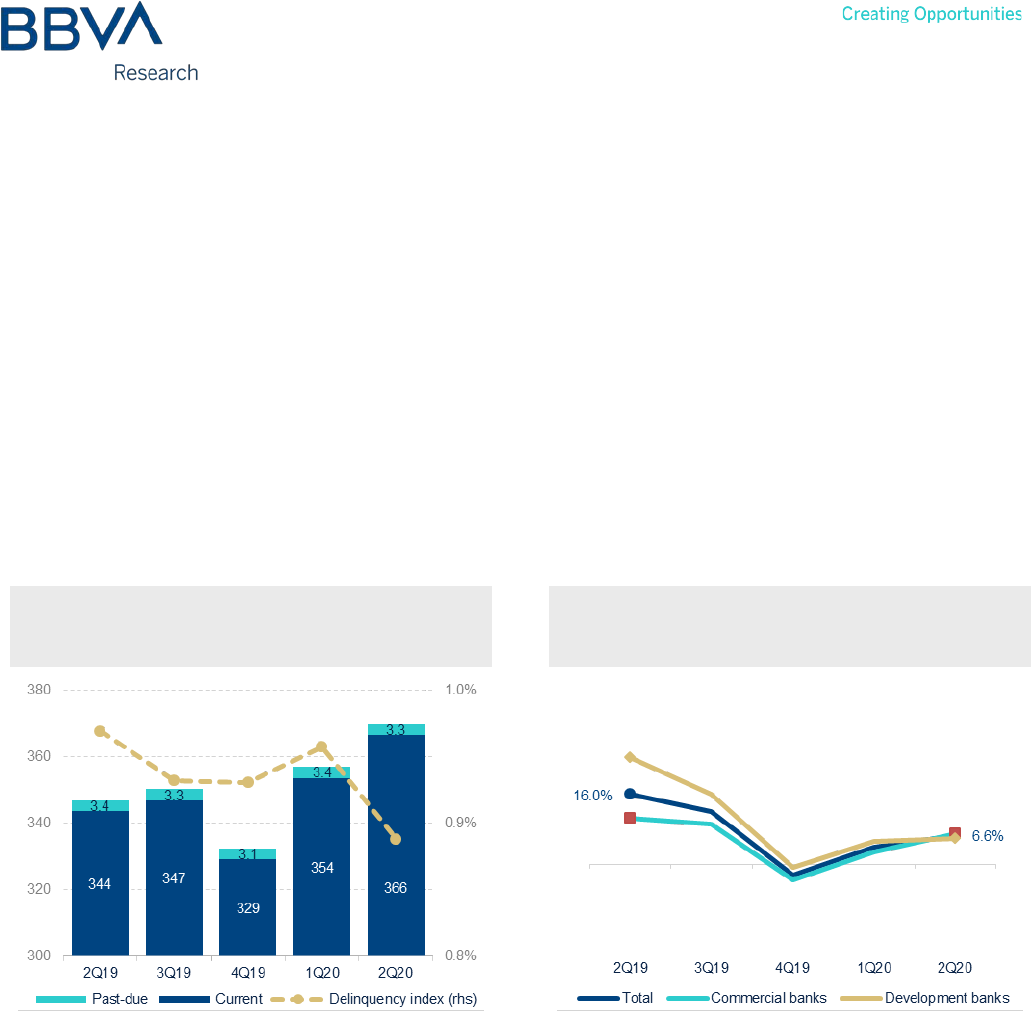
Year on year, the balance of this portfolio grew marginally, only 4.6% in 1Q20 and 4.0% in 2Q20. In any case, this
marks significant progress given the fall in activity and when compared with the double-digit growth in the previous
year. Commercial and development banking have maintained momentum in their lending, although commercial
banking maintains a 74% share. Although the period of economic depression persists, this portfolio's delinquency has
at least been contained at low levels so far, at only 1.4%. While a further decline is to be expected, we predict it will be
curbed by the quality of origination, the increase in reserves by banks and the sector's tendency to provide collateral on
its loans.
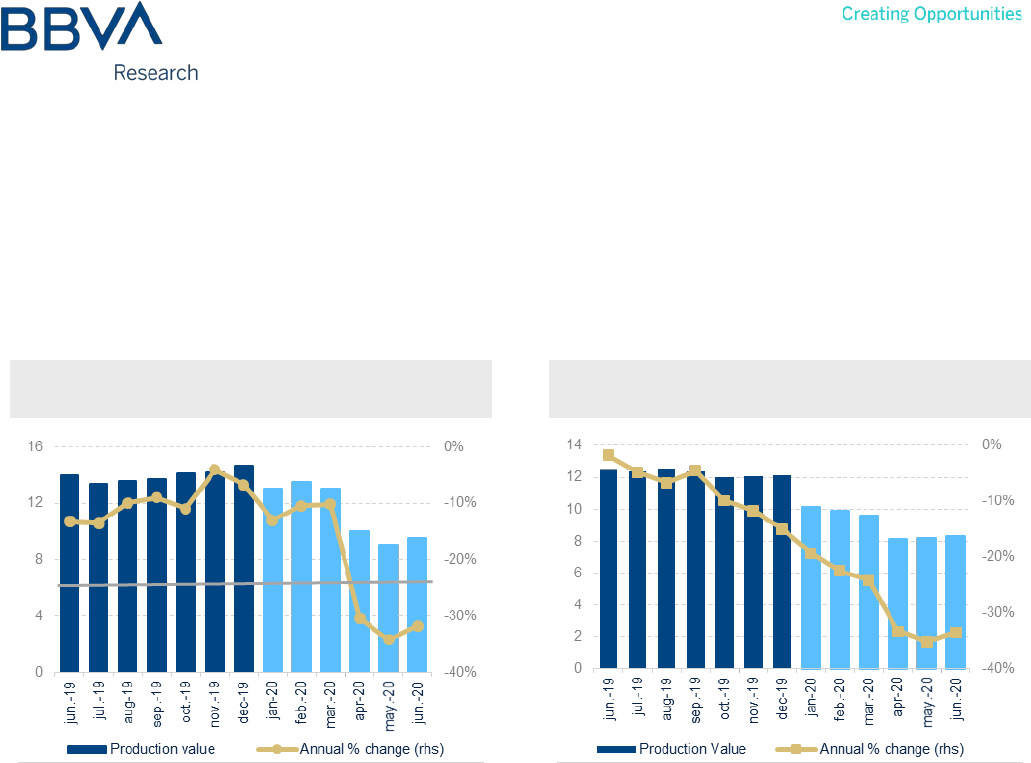
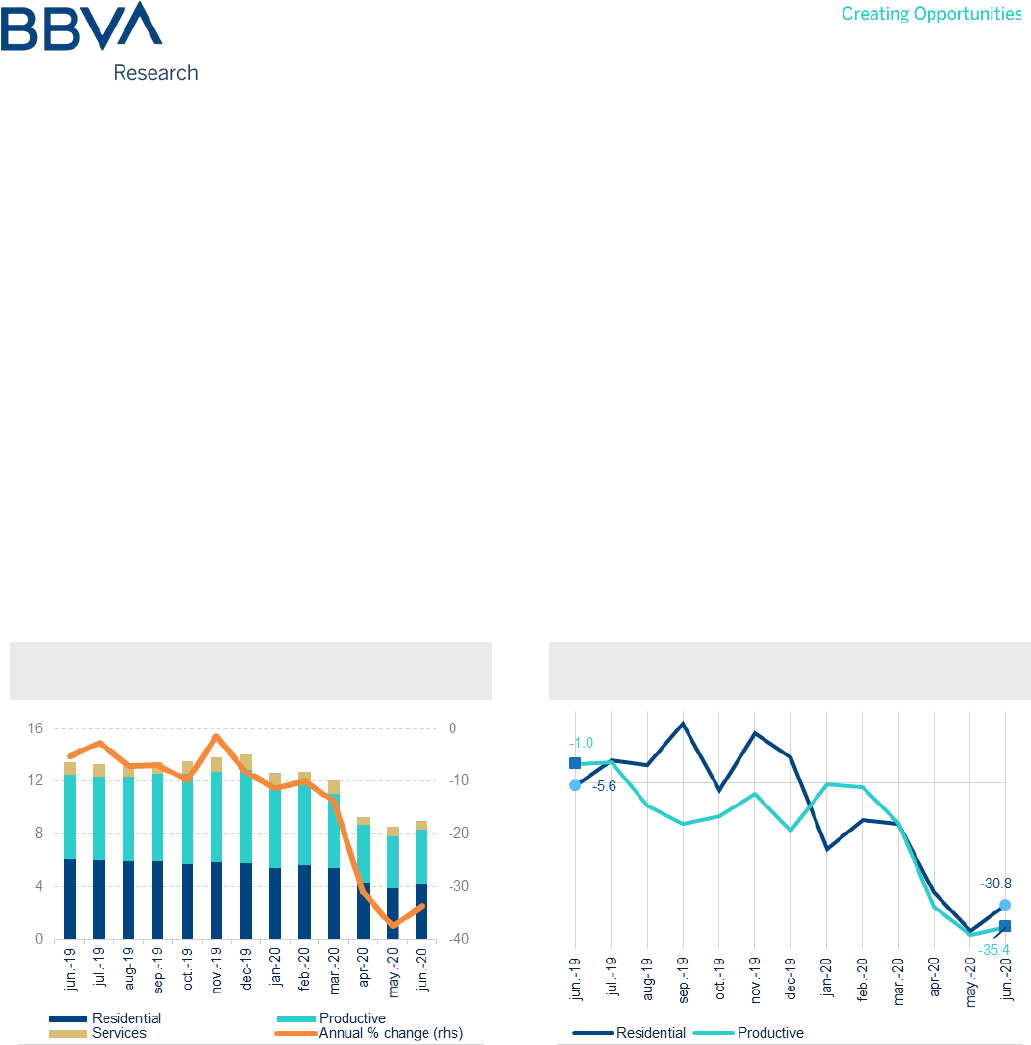
The building slump now based on all of areas of activity
Within building, all types of work are suffering a decline. The strongest effects come from housing construction and
productive building, although works associated with services such as schools and hospitals have also declined. These
types of work had already been suffering contraction since the beginning of 2019, and although housing seemed to
revive, it changed direction from the beginning of 2020 before the start of the health emergency. In 2Q20, both
residential and productivity building were already down and, by June, the value of output displayed rates below -30% in
year-on-year terms. As in other sectors, 2Q20 recorded the lowest levels due to ceased activities.
Figure 2a.16 BUILDING GROSS VALUE
(MXN BILLIONS AND YoY % CHANGE)
Figure 2a.17 BUILDING GROSS VALUE
(YoY % CHANGE)
Source: BBVA Research based on INEGI ENEC data
Source: BBVA Research based on INEGI ENEC data
The credit balance for this type of work grew marginally in 2Q20, only 0.8% in real terms, due to the combination of a
1% progress in commercial banking and a 2% reduction in development banking. A significant part of the increased
demand for funding would be provided by construction companies' search for liquidity to circumvent the period of
economic contraction, in the hope that activity will normalize. Delinquency in this portfolio is 2%, but could see a slight
increase by the end of the year as construction of these works continues to stagnate. One stimulus could be the
resumption of manufacturing and foreign trade, which could lead to a recovery of productive building first, long before
its residential counterpart.
Mexico Real Estate Outlook. Second half 2020 11
Figure 2a.18 BUILDING CREDIT BALANCE
(MXN BILLIONS AND %)
Figure 2a.19 BUILDING CREDIT BALANCE
(YoY % CHANGE)
Source: BBVA Research based on Bank of Mexico data
Source: BBVA Research based on Bank of Mexico data
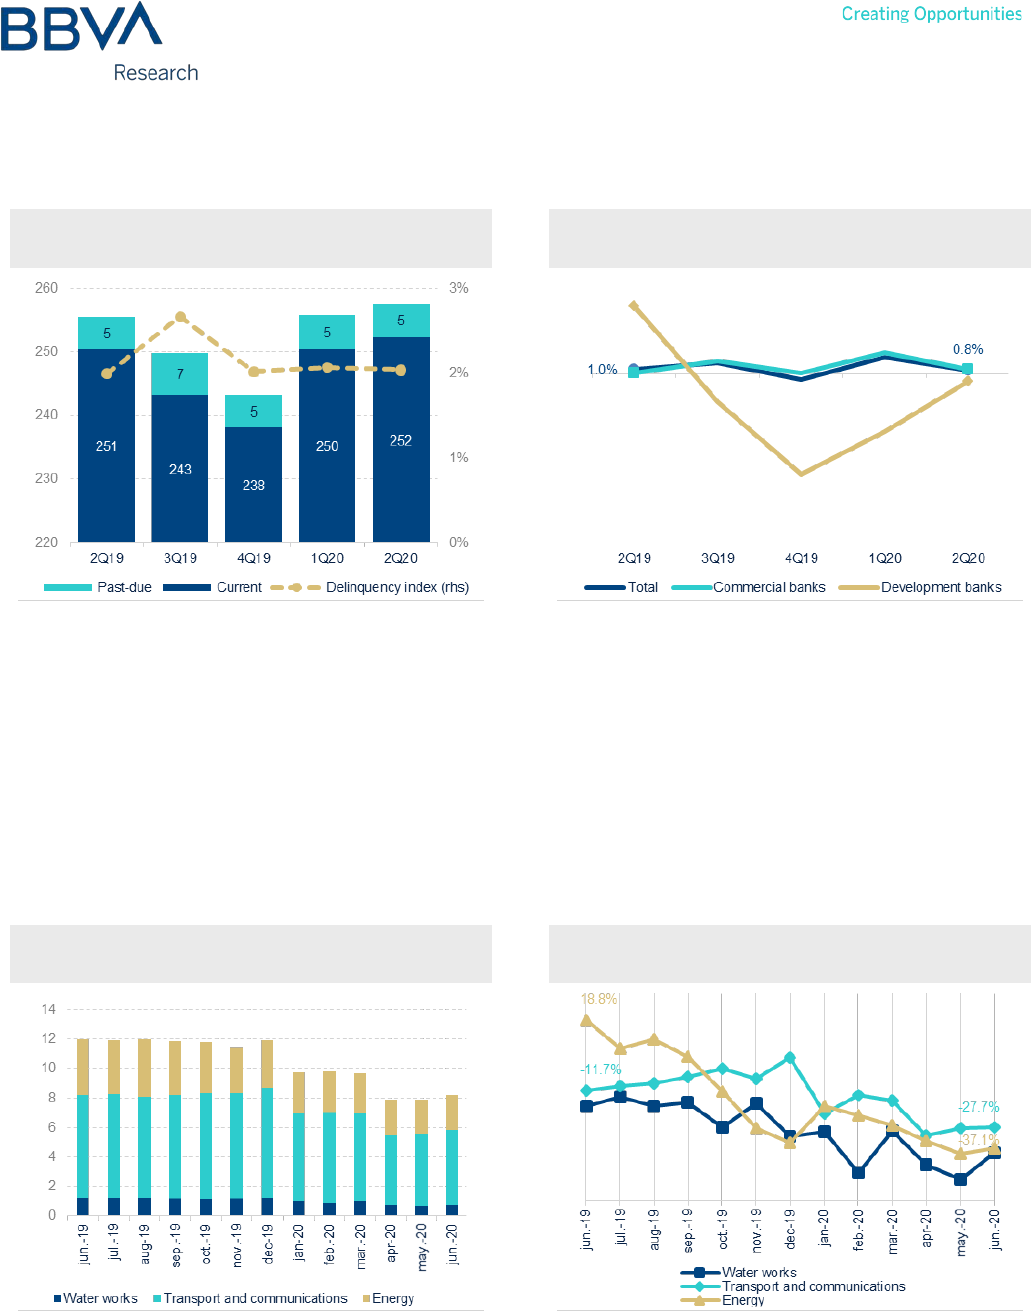
Infrastructure sinks deeper despite major projects
The value of civil engineering is at historically low levels. It was believed to have bottomed out in 2019, but this was not
the case. Now, the value of infrastructure built each month in 2020 averages less than MXN 10 billion. Even the gross
value of energy works is down more than 37% in 2Q20. All types of work associated with infrastructure have
experienced a sharp decline. The value of constructions in communications and transport averaged a variation of -
17.2% in 1Q20, which increased to -29.1% in 2Q20. This is despite the fact that the major works of this administration
did not cease during the health emergency. In energy infrastructure, positive rates have not been seen since mid-2019,
while for the other two types this is since 2018 (all rates based on their year-on-year comparison).
Figure 2a.20 INFRASTRUCTURE GROSS VALUE
(MXN BILLIONS)
Figure 2a.21 INFRASTRUCTURE GROSS VALUE
(YoY % CHANGE)
Source: BBVA Research based on INEGI ENEC data
Source: BBVA Research based on INEGI ENEC data
Mexico Real Estate Outlook. Second half 2020 12
The positive outlook could be for the energy sector. This is based on the substantial investments included in the 2021
Draft Federal Budget; but with regard to communications and transport, there is no investment in this type of
construction. The absence of the National Infrastructure Plan in the current administration reveals a lack of direction
and, therefore, low expectations of recovery. This is despite how important it is to employment, potential GDP and the
economy as a whole. Without direction in terms of planning and investment, the low cost of financing cannot be a
stimulus for recovery. Moreover, investment certainty is essential so that the private sector can also help build
infrastructure to drive growth.
In a similar sense to building, bank credit to infrastructure slowed during 2019 and closed the year falling at an annual
rate of 2.4%, mostly on the commercial banking side (-3.6%). The balance stood at MXN 332 billion in 4Q19, with
delinquency of just 0.9%. However, demand for funding led to an amount of MXN 357 billion recorded for this portfolio
in 1Q20, which rose again to MXN 369 billion in 2Q20. Credit growth is the result of both the commercial banking and
development banking portfolios. The latter has increased its share slightly, increasing from 38.7% in 2Q18 to 41.4% in
2Q20, as part of the federal government's strategy to finance its flagship works.
Figure 2a.22 INFRASTRUCTURE CREDIT
BALANCE
(MXN BILLIONS AND %)
Figure 2a.23 INFRASTRUCTURE CREDIT
BALANCE
(YoY % CHANGE)
Source: BBVA Research based on Bank of Mexico data
Source: BBVA Research based on Bank of Mexico data
The construction slump is set to continue into this year and next
No sign of recovery is in sight for construction. On the building side, housing needs to see a boost in demand, mainly in
the social housing segment, which is by far the largest in the Mexican market. Greater investment in productive
building is also required in this sub-sector in order to get back on track toward growth. In any case, the industrial
premises line may be the first to show positive signs, but not any time soon, thanks to manufacturing and foreign trade.

Mexico Real Estate Outlook. Second half 2020 13
Civil engineering is only displaying momentum through specific communications and transport works. The most solid
foundation will be energy infrastructure once public investment plans in this area come to fruition. However, it will not
be enough to make up the ground lost by the sector. Private sector involvement and attributing certainty to such
investments will be essential.
Figure 2a.24 LEADING INDICATORS
(YoY % CHANGE)
Figure 2a.25 CONSTRUCTION GDP
(YoY % CHANGE)
Source: BBVA Research based on SCNM and INEGI data
Source: BBVA Research based on SCNM and INEGI data
Business confidence indicators and willingness to invest are currently at their lowest. A change of direction is unlikely in
the short term. The construction sector requires major investment for a return to growth. Based on this information, we
estimate that the GDP of construction could plummet 19.2% during 2020, with a forecast variation of -7.3% the
following year. In this instance, an incorrect prognosis would be the ideal scenario, with the impact proving much
smaller.

Mexico Real Estate Outlook. Second half 2020 14
2b. The mortgage cycle faces the worst crisis
Introduction
In our last issue of Mexico Real Estate Outlook, we mentioned the impact of the economic crisis caused by the
COVID-19 pandemic on the real estate market. However the downturn is evident throughout the economy; formal
employment, which we know is the main determinant of housing demand, is experiencing one of its greatest crises in
recent history, even more severe than in the 2008–2009 episode.
As such, in this section, we will review the performance of the main housing market indicators within the framework of
the current economic cycle. While the housing finance market is relatively young in Mexico, it has already seen key
moments in the past 20 years. This will therefore allow us to identify the possible effects of the current crisis and
estimate the time that the market could take to recover.
Mortgage banking contracted 19.4% in the first half of 2020
The mortgage market achieved moderate growth in 2019, despite the adversities of the economic slowdown. After this
respite, in 2020, the widespread crisis caused by COVID-19 has had severe repercussions in the mortgage market. At
the end of the first half of 2020, the amount of system-wide financing contracted 14.8%, while the commercial banking
market fell 19.4%, respectively, both in real terms.
Table 2b.1 MORTGAGE ACTIVITY BY AGENCY
(THOUSANDS OF LOANS AND MXN BILLIONS AT 2020 PRICES, CUMULATIVE FIGURES)
Mortgage Origination
Number of loans
(thousands)
Loan amount
(MXN billions)
Average amount
(MXN thousands)
Jun-19 Jun-20
YoY %
change
Jun-19 Jun-20
YoY real %
change
Jun-19 Jun-20
YoY real %
change
Public Institutions
174.8
162.8
-6.9
91.3
82.4
-9.8
522
506
-3.1
Infonavit
152.8
140.1
-8.3
74.8
65.7
-12.1
489
469
-4.1
FOVISSSTE
21.9
22.6
3.2
16.6
16.7
0.7
754
736
-2.4
Private Sector*
65.6
51.4
-21.7
98.2
79.2
-19.4
1497
1542
3.0
Banks
1
65.6
51.4
-21.7
98.2
79.2
-19.4
1497
1542
3.0
Other
Subtotal
240.4
214.1
-10.9
189.6
161.6
-14.8
788
755
-4.3
Co-financing
2
(-)
19.5
10.8
-44.6
Total
220.9
203.3
-8.0
189.6
161.6
-14.8
858
795
-7.4
*Although there are other private credit institutions (such as non-regulated agents), these are excluded due to a lack of reliable public information.
1: Includes: loans for self-construction, restructuring, acquisition, loans to former employees of financial institutions and loans for payment of liabilities and liquidity.
2: Loans granted in conjunction with Infonavit and FOVISSSTE.
Note: the adjustment factor is based on the Federal Mortgage Company (SHF) housing price index; 2017 Base = 100
Source: BBVA Research based on Infonavit, FOVISSSTE, CNBV and SHF data
In terms of the activity of housing institutes, Infonavit granted 12.1% less mortgage financing, equivalent to an 8.3%
contraction in the number of loans. For its part, FOVISSSTE achieved an increase of just 0.7% in the real amount and
a rise of 3.2% in the number of loans. However, it should be emphasized that this slight growth was thanks to a good
Mexico Real Estate Outlook. Second half 2020 15
start to the year, as the Fund had carried over a volume of outstanding loans from the last quarter of 2019, an effect
that was then exhausted by the end of June.
Figure 2b.1 MORTGAGE FINANCING, JANUARY-
JUNE (CONSTANT MXN BILLIONS,
CUMULATIVE FIGURES)
Figure 2b.2 JANUARY-JUNE MORTGAGE
FINANCING
(CONSTANT MXN BILLIONS, MONTHLY FLOWS)
Source: BBVA Research based on CNBV data
Source: BBVA Research based on CNBV data
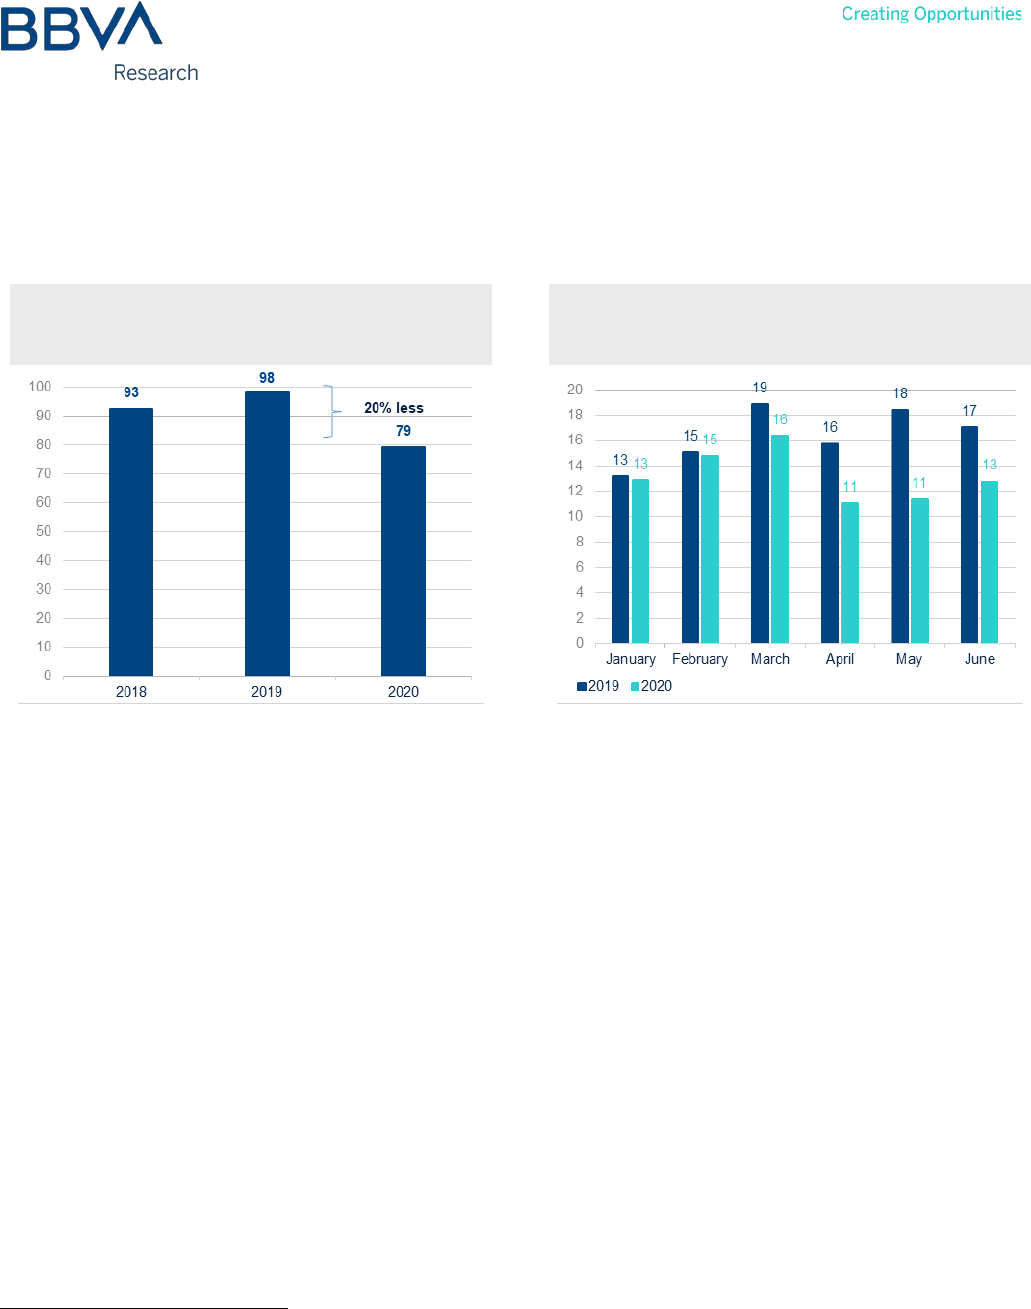
By comparing the cumulative amount of financing generated in the first half of the last three years, we see that after
having achieved growth in 2019, the accumulated amount of mortgage origination in 2020 was down 20% in real
terms. This marked the lowest point of the analysis period.
Although the economic downturn intensified in the second half of 2019, demand for mortgage financing was marginally
affected during the first quarter of the year in January and February. However, the crisis caused by the COVID-19
pandemic significantly lowered demand from March, meaning that the adverse effects were already reflected in the
second quarter. As shown in Figure 2, monthly financing flows were on average 30% less for the three months of April,
May and June alone.
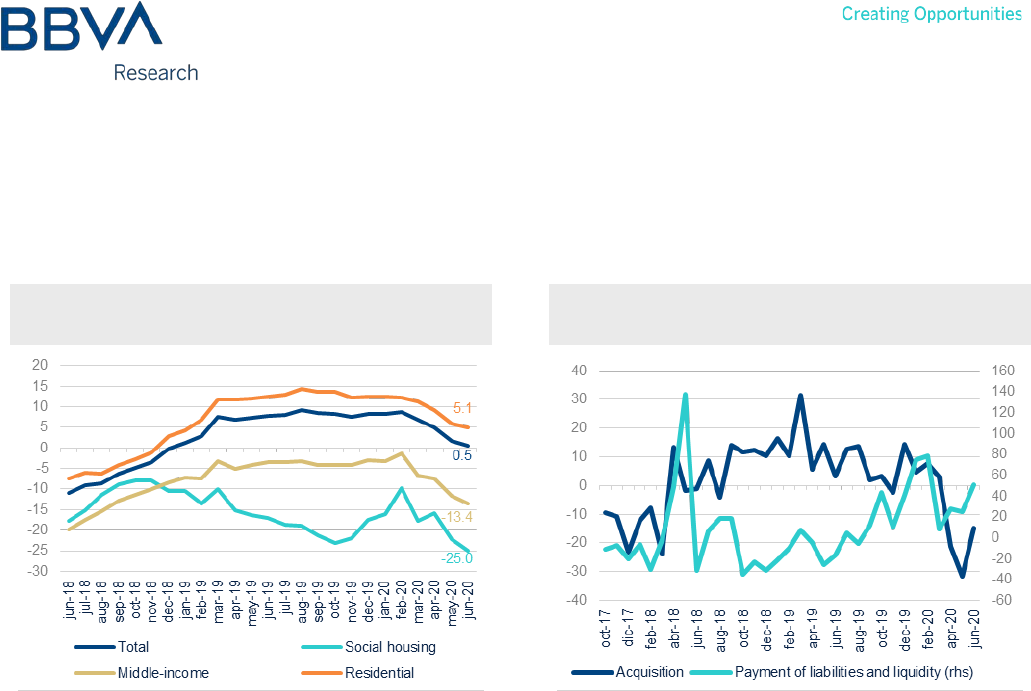
The residential segment managed to stay afloat in the first half
While we have seen a decline in banks' cumulative figures for the first six months of the year, a marginal increase of
just 0.5% is still visible in terms of annualized figures.
1
This is due to the positive performance of residential segments
last year, which have managed to maintain the employment inertia caused a few years ago, low mortgage interest
rates and the strengthening of real wages. All of the above showed considerable strength, and therefore still provided a
stimulus due to the lagged effect on this market. Conversely, the mid-range and social housing segments, which
represent around 50% of commercial banking placement, have been on negative ground for more than two years.
Although this support in the higher-priced segments (which seems to have been exhausted) helped banking to stay
1: In real growth rates updated in accordance with the Mexican Consumer Price Index (INPC).
Mexico Real Estate Outlook. Second half 2020 16
afloat between 2019 and 2020, the impact of the crisis caused by the COVID-19 pandemic will be more visible in the
coming months.
Figure 2b.3 BANK MORTGAGE LOANS (YoY %
CHANGE, ANNUALIZED FIGURES)
Figure 2b.4 BANK MORTGAGE LOANS (YoY %
CHANGE, MONTHLY FLOWS)
Source: BBVA Research based on CNBV data
Source: BBVA Research based on CNBV data
While we see a clear downward trend in mortgage origination at the end of the first half of 2020, non-acquisition
products, such as liability and liquidity financing, show a clear upward trend. As in other episodes in recent history,
these come to play an important role in the cycles of interest-rate reductions, but, this time, they will also be
strengthened by the economic crisis. Banks will seek to increase their mortgage portfolios by offering more competitive
rates to customers with an existing mortgage, in a bid to gain market share. This option will be the fastest way to offset
the lower origination of new mortgages in an environment where demand tends to decline.
The drop in formal employment translates into less demand
As mentioned in the previous section, conditions for the main determinants of mortgage loan demand were favorable
until before the COVID-19 pandemic broke out, even despite the economic uncertainty already surrounding the
contraction of GDP in 2019. However, this optimum combination of factors such as employment and real wages has
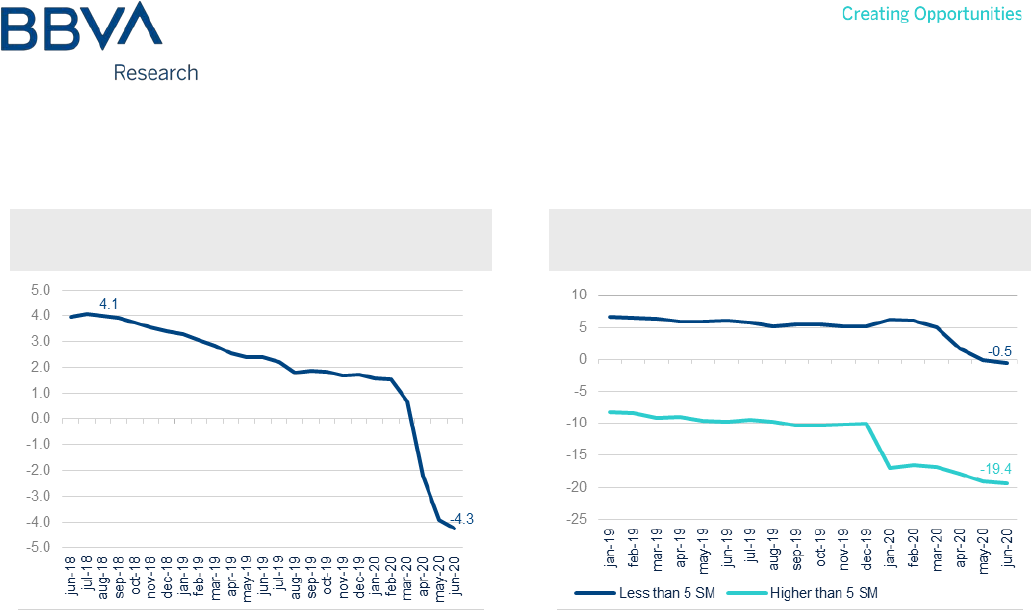
faded further into the background with the onset of the health crisis. In the first half of 2020 alone, the number of
workers insured at the IMSS (Instituto Mexicano del Seguro Social — Mexican Social Security Institute) fell by 4.3%.
Mexico Real Estate Outlook. Second half 2020 17
Figure 2b.5 IMSS-INSURED WORKERS
(YoY % CHANGE)
Figure 2b.6 IMSS-INSURED WORKERS, SALARY
GRADE (YoY % CHANGE)
Source: BBVA Research based on IMSS data
Source: BBVA Research based on IMSS data
From March to June 2020 alone, 1.1 million jobs were lost, with a forecast 1.5 million job losses by year end. Even if
we break employment down into those who earn more than five times the minimum wage and those who earn less
than this level, we see that there was an increase up until April in the insured workers who receive a lower wage level.
However, workers who earn more than five times the minimum wage and who are the main focus of demand for bank
credit were already in outright decline since 2019.
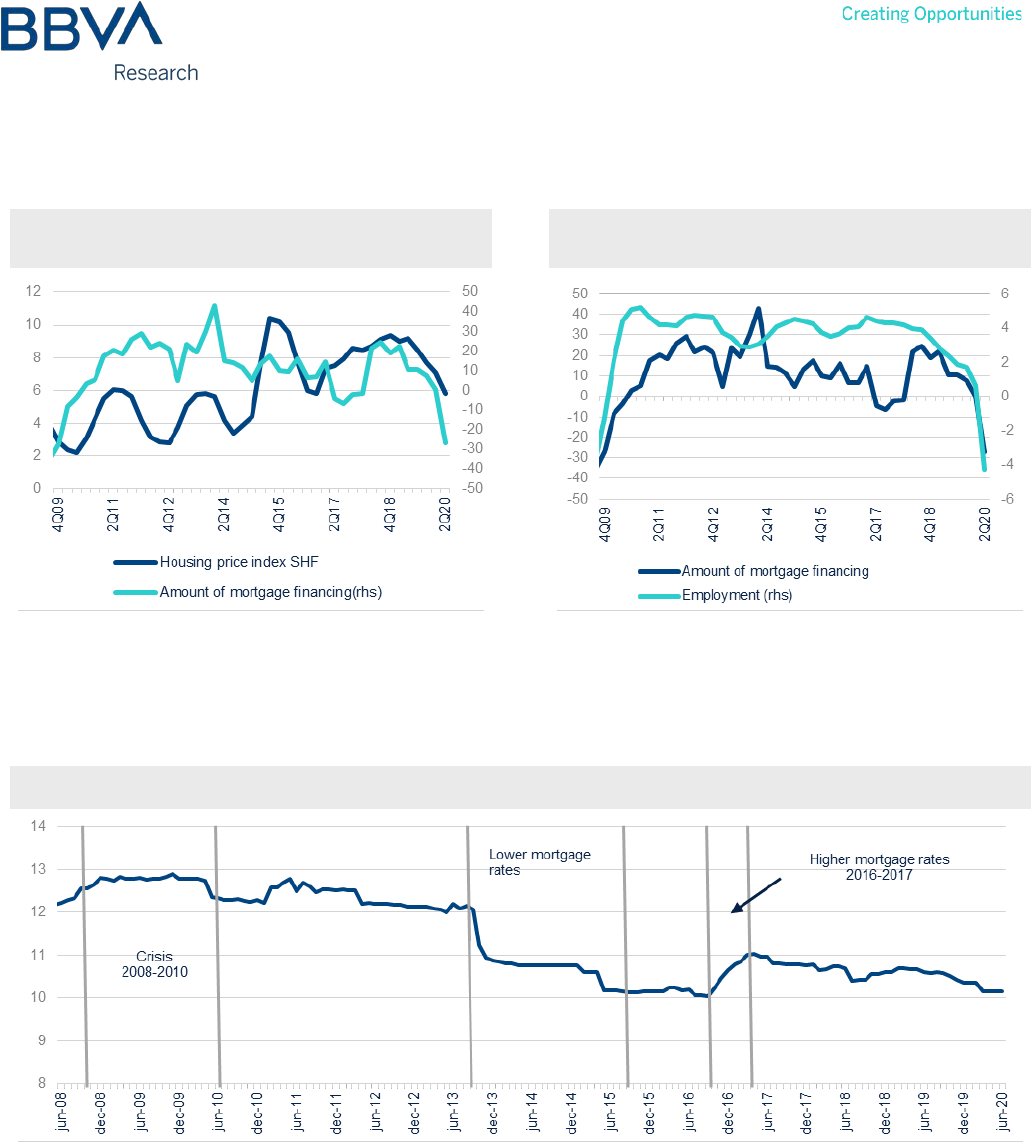
While the mortgage market had not faced a similar crisis since 1995, it is not comparable to the current one, given the
credit conditions at that time and the construction model whereby the public sector was virtually the main player. The
most similar critical event would therefore be the 2009–2010 global economic crisis.
As such, in a long-term context, we can make a brief comparison of how long it took for mortgage financing demand to
recover based on the how long it took for employment to return to growth.
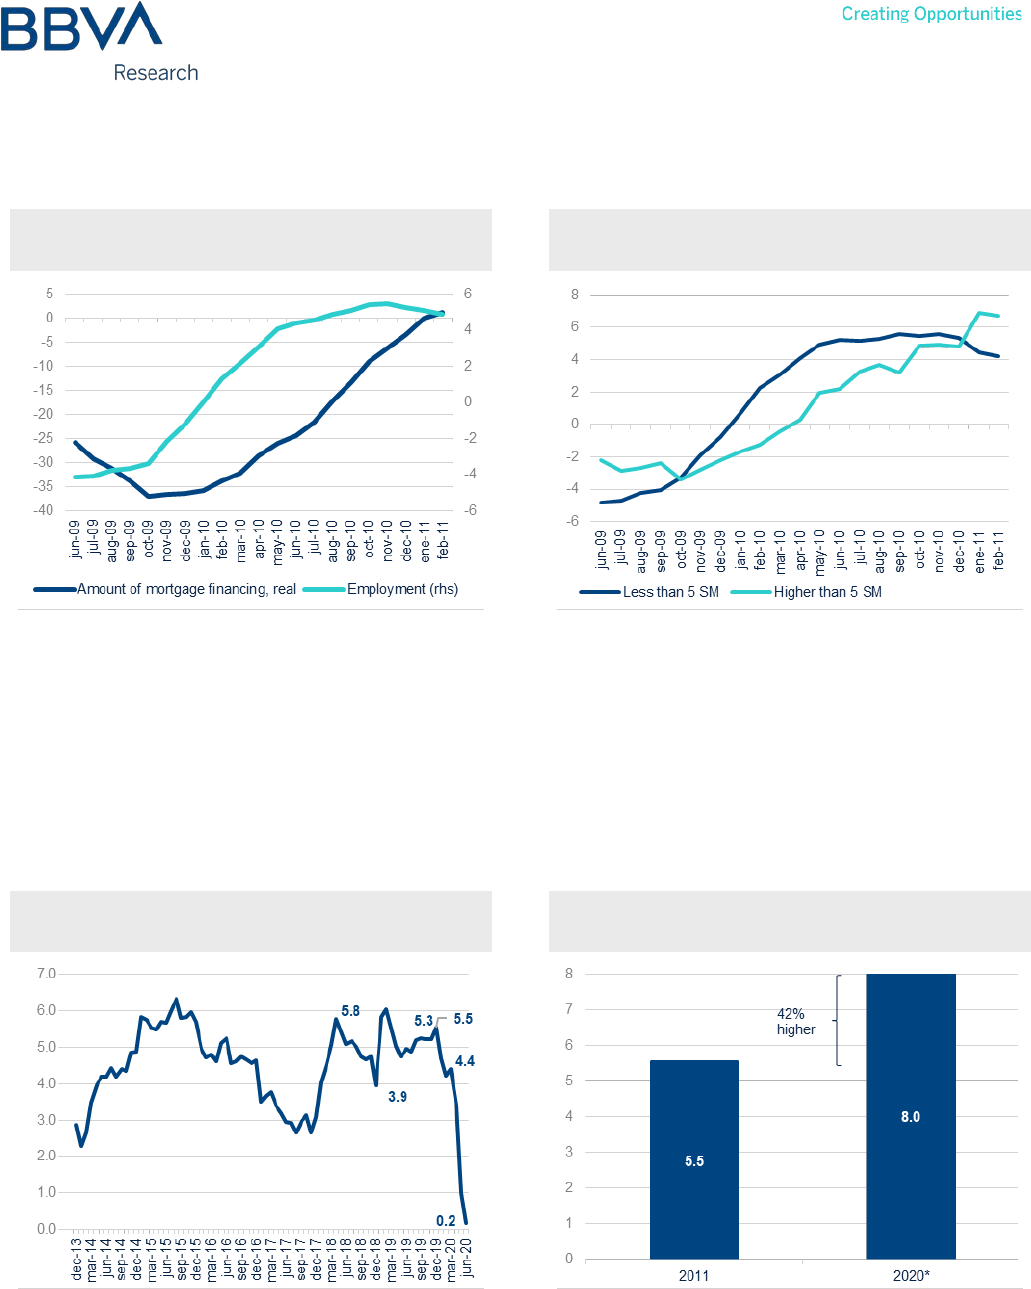
We have consistently made reference to the lag between employment growth cycles and mortgage financing. During
the 2009 crisis, the lowest point in employment contraction occurred in June 2009, equivalent to a loss of nearly
700,000 jobs, whereas the turning point at the bottom of the mortgage financing amount cycle was recorded in October
of the same year.
Mexico Real Estate Outlook. Second half 2020 18
Figure 2b.7 2009 CRISIS. RECOVERY, FINANCING
AND EMPLOYMENT (YoY % CHANGE)
Figure 2b.8 2009 CRISIS. EMPLOYMENT
RECOVERY (YoY % CHANGE)
Source: BBVA Research based on IMSS and CNBV data
Source: BBVA Research based on IMSS data
It took around nine months for employment to enter positive ground and one year to return to the pre-crisis employment
level. Even the employment of workers who earn more than five times the minimum wage followed a similar trajectory.
For the latter, the mortgage financing amount took 17 months to record a positive growth rate again, i.e. almost a year
and a half.
Conversely, real wages, which had performed well over the past two years, partly due to stable inflation and wage
increases as a result of regulatory measures, barely increased 0.2% in real terms in June and could see a downturn
over the coming months.
Figure 2b.9 ACTUAL TOTAL WAGE BILL
(YoY % CHANGE)
Figure 2b.10 AVERAGE ACTUAL TOTAL WAGE
BILL (CONSTANT MXN BILLIONS)
Source: BBVA Research based on IMSS and INEGI data
*Annualized figures as of June.
Source: BBVA Research based on IMSS and INEGI data
Mexico Real Estate Outlook. Second half 2020 19
An important factor to mention is that, despite the fall in formal employment, the volume of workers who currently pay
contributions to the IMSS receive a larger actual wage bill, compared to those in 2011 when employment and
mortgage financing recovered. In 2020, the average wage bill over the last twelve months has been 40% higher than
the last crisis, which, as we have already seen, has considerably improved access to bank credit in the period leading
up to the crisis caused by the pandemic.
Figure 2b.11 CONSUMER CONFIDENCE, ORIGINAL
(YoY % CHANGE)
Figure 2b.12 CONSUMER CONFIDENCE, TREND-
CYCLE (YoY % CHANGE)
Source: BBVA Research based on INEGI data
Source: BBVA Research based on INEGI data
However, before considering widespread recovery, consumer expectations must improve considerably, as they are
highly correlated with the formal employment trend. We have commented in previous issues that the demand for
mortgage financing manifests around 12 to 18 months after a worker enters the formal sector, so consumer confidence
is not expected to grow until employment shows strong signs of recovery.
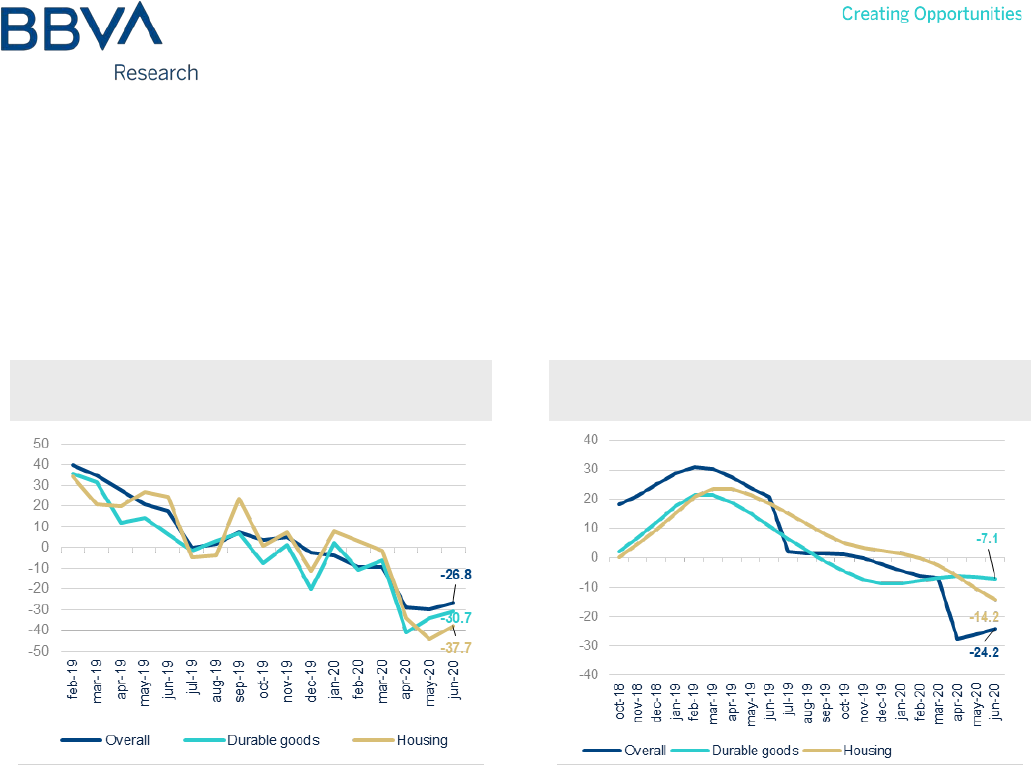
As of June, according to INEGI data, the overall consumer confidence index in the original series recorded an annual
contraction of 26.8%, while the housing and durable goods subindex contracted by 30.1% and the housing subindex
fell by 38%. Conversely, in the trend-cycle series, the confidence in housing subindex surpassed the durable goods
subindex for the first time since April 2019 and fell 14.2% at the end of June. Consumer confidence is likely to remain
unchanged during 2020, although it is possible that a turning point has already been reached in June, which could
mark the start of a difficult path to return to positive ground. This optimum combination, which lasted for many years,
now faces the worst economic crisis since 1929. As a result, the effects of this crisis will be more visible in the second
half of 2020 and throughout 2021.
Supply conditions are a key strength
As far as the mortgage loan market is concerned, financing conditions have remained at entirely favorable levels. The
beginning of the crisis caused by the COVID-19 pandemic triggered a cycle of falling interest rates, both in the short
term and in the long term.
Mexico Real Estate Outlook. Second half 2020 20
This has certainly had a positive impact on the financing market and confirms that supply is not restricted by credit. In
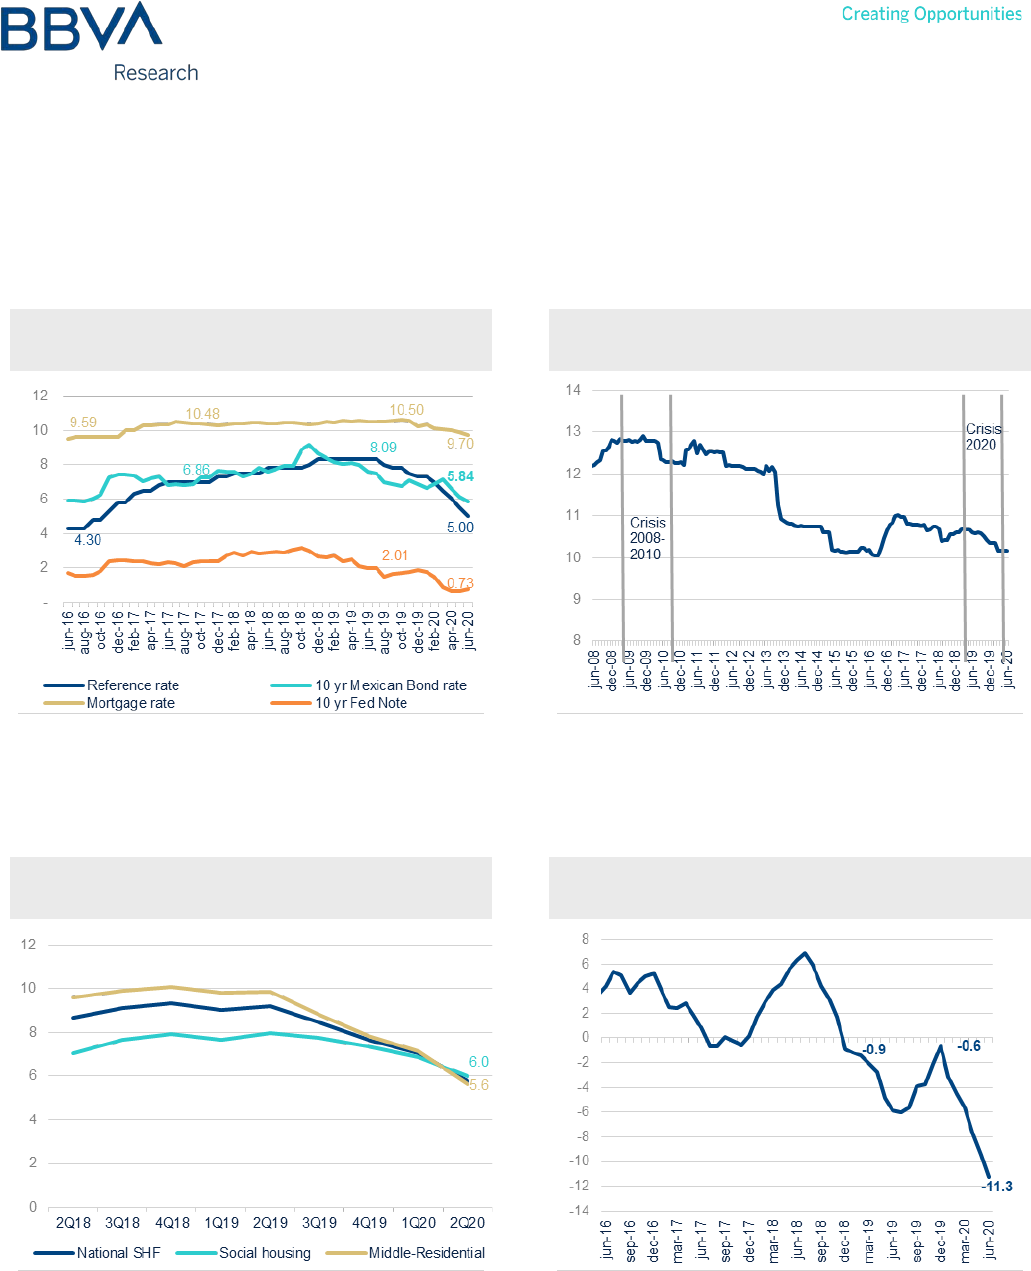
fact, since the end of 2019, the cycle of declines in both short-term rates and in the FED's M0 and Treasury note
became evident. The mortgage interest rate reached levels of 9.7% in June, while the M10 bond rate reached 5.84%.
Figure 2b.13 INTEREST RATES
(% NOMINAL ANNUAL RATE)
Figure 2b.14 MORTGAGE INTEREST RATE
(YoY % CHANGE)
Source: BBVA Research based on Banxico, Bloomberg and CNBV data
Source: BBVA Research based on Banxico data
These rate levels are not comparable to those recorded in the 2009–2010 crisis, when mortgage rate levels were
between 12% and 13%, which had no adverse effect on the market because, as we have already seen, recovery in
higher-paid employment was vigorous during those years and in line with low and high income levels.
Figure 2b.15 HOUSING PRICE INDEX (YoY %
CHANGE)
Figure 2b.16 VALUE OF HOUSING OUTPUT (REAL
YoY % CHANGE)
Source: BBVA Research based on SHF data
Source: BBVA Research based on INEGI ENEC data
Mexico Real Estate Outlook. Second half 2020 21
Housing prices have continued to rise, albeit at more moderate rates due to the general decline in demand. In June,
the overall index increased by 5.8%. However, we observed annual rates of 6% in the social housing segment and
5.6% in the mid-range residential segment. This has also been a positive impact of the decline in housing output by
construction companies, which have aligned themselves with the reduced market size and have not engaged in
excessive output that could be difficult to place.
Figure 2b.17
HOUSING PROJECTS IN THE RUV
(THOUSANDS OF RECORDS AND YoY %
CHANGE)
Figure 2b.18
HABITABLE HOUSING IN THE RUV
(THOUSANDS OF RECORDS AND YoY %
CHANGE)
Source: BBVA Research based on RUV data
Source: BBVA Research based on RUV data
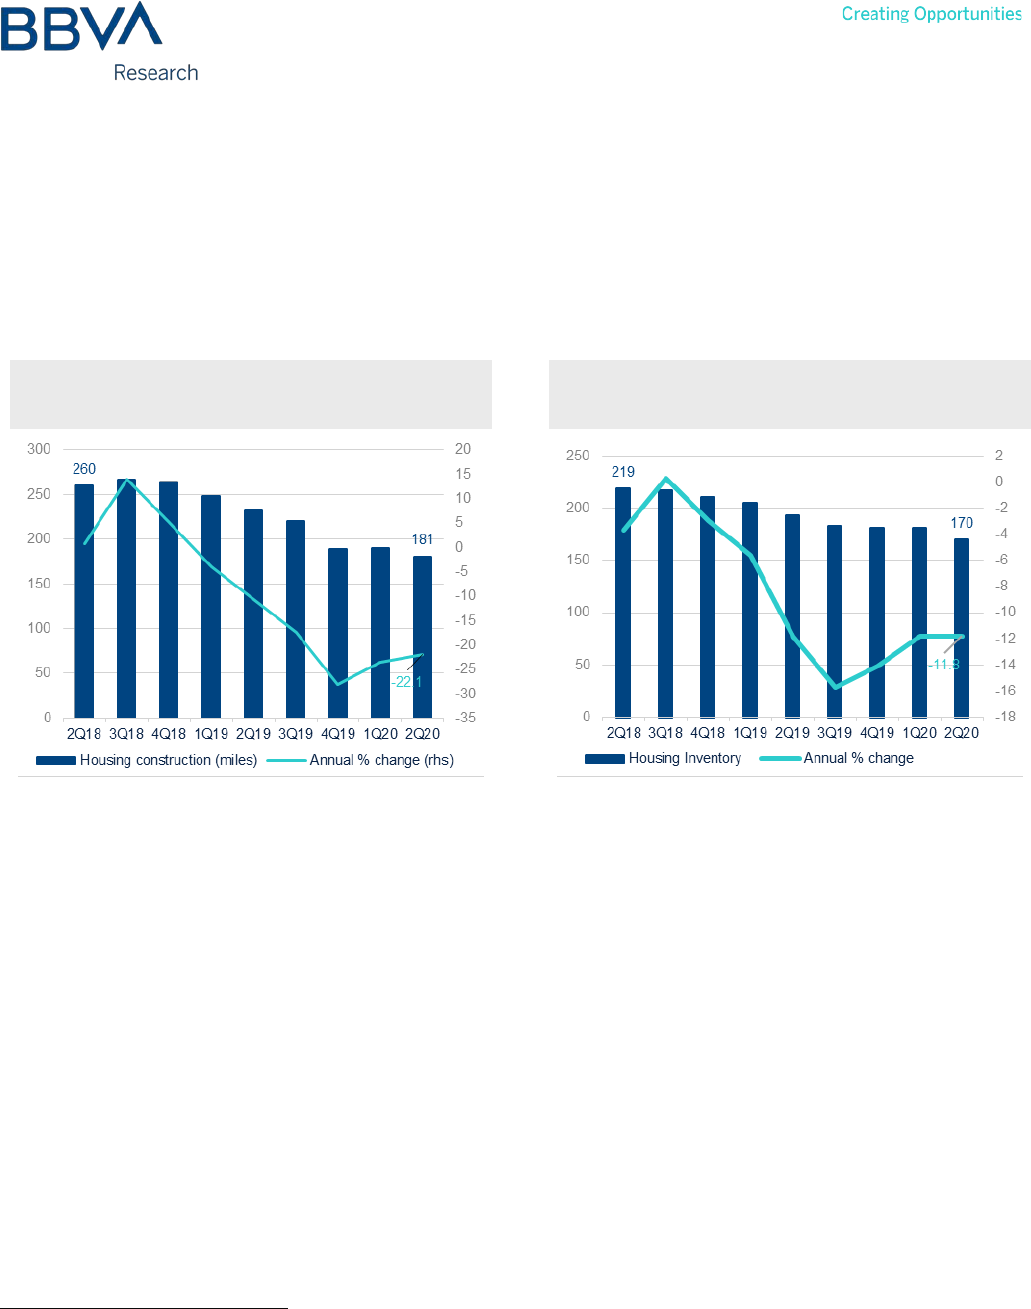
The housing construction projects in the RUV (Registro Único de Vivienda — Mexican housing registry) also confirm
the output performance observed in the INEGI's ENEC. In the second quarter of 2020, housing construction projects
are down 22.1%, while habitable housing, i.e. the inventory of new housing with basic services installed and ready for
sale, has decreased by 12%. As on previous occasions, we see this as a healthy development, as it guarantees the
continuous appreciation of housing stock and maintains the value of real estate guarantees. Once again, developers
have demonstrated their ability to adapt efficiently to the real estate cycle. In this case, the number of projects is
already very similar to the number of habitable units, i.e. near an equilibrium value.
The mortgage portfolio remains healthy
The mortgage portfolio balance has continued to grow in 2020, albeit at a lower rate. While in 2019 it grew by an
average of 5.1% in real terms, in the first six months of 2020 it was up 6.1% in real terms. This is explained by an
increase in the current portfolio, which grew 4.9% and 5.6% over the same periods. As we have already seen, the
increased origination in residential segments in real terms provided a boost in the months leading up to the pandemic,
but is already beginning to slow down.
2
%. Between January and June 2020, the average delinquency rate remained at 3%. In other words, the measures put
in place by the banks to defer the payment of mortgages as a result of the crisis caused by the COVID-19 pandemic
2: Mortgage portfolio items are updated in accordance with the INPC.
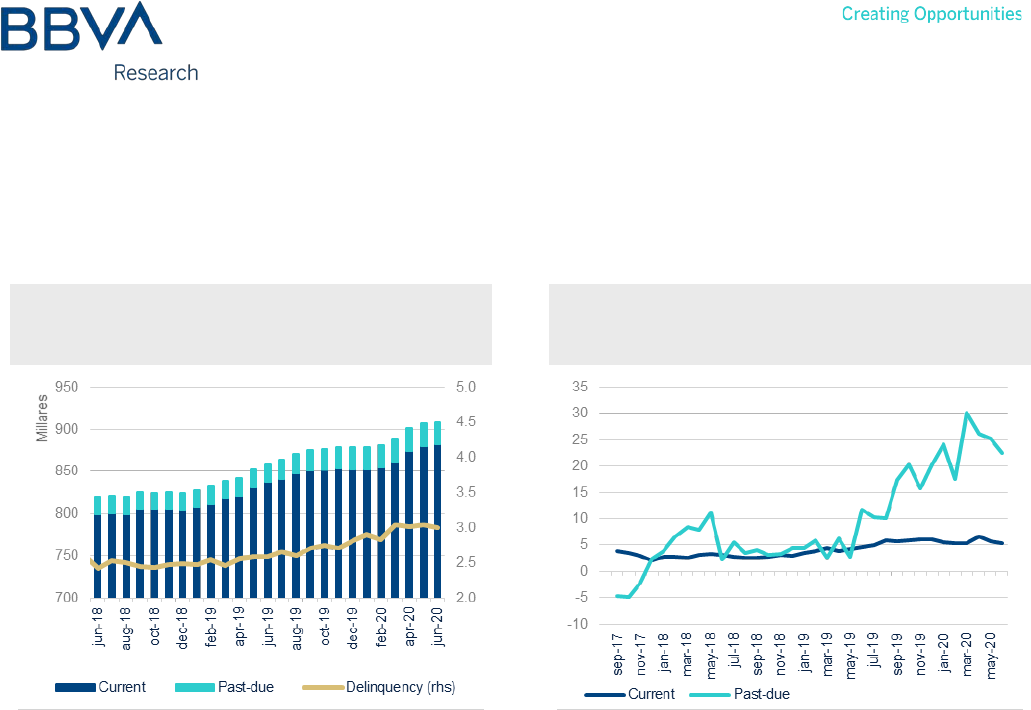
Mexico Real Estate Outlook. Second half 2020 22
were undoubtedly an assertive measure. However, going forward, delinquency could result in a decline if the situation
does not improve in terms of a recovery in employment.
Figure 2b.19 MORTGAGE LOAN PORTFOLIO
BALANCE (CONSTANT MXN BILLIONS AND
DELINQUENCY, %)
Figure 2b.20 MORTGAGE LOAN PORTFOLIO
BALANCE
(YoY % CHANGE)
Source: BBVA Research based on Banxico data
Source: BBVA Research based on Banxico data
Conclusions
2020 is proving to be a year filled with many challenges for mortgage banking. While it has already faced lower
economic activity since 2019, mortgage banking is confronted this year with the most severe economic crisis, which
many say is the worst since the great crisis of 1929. However, we only need to make a few comparisons with the 2009
crisis to put some key differences into context.
Employment will once again be the key to determining recovery times. According to BBVA Research's forecasts, the
IMSS job losses that could exceed 1.5 million by year-end could take around 15 months to see a positive growth rate
and more than 40 months to return to the pre-crisis employment level.
As a result, the mortgage financing amount could contract by between 25% and 28% in real terms this year. Recovery
will depend largely on formal employment, given that conditions have been favorable in terms of financing. Even the
slowdown in housing prices could be an incentive to take out a new loan or to seek restructuring with a bank offering a
competitive rate, which will increase the supply of the liability payment figure.
As has been the case in other similar episodes, crises are also opportunities for acquisition at a better price and
preferential rates, meaning that consolidated recovery will be waiting in the wings for the revival of employment with
unbeatable financing conditions, which have so far reflected the long-term certainty momentarily lost by the real
economy.
Mexico Real Estate Outlook. Second half 2020 23
3. Special Topics
3a. SMEs play an increasingly important role in construction
SMEs are increasing in number, but more so in their contribution
The construction sector has been in a slump since 2018. This result is largely due to long-term changes in its structure.
On the one hand, residential construction (the main component of building) has been in decline for several years as the
social housing segment becomes less relevant. On the other hand, lower investment in infrastructure has resulted in
civil engineering also stagnating for years. This suggests a structural change in construction. The size of the required
scale could be shrinking as sectoral GDP contracts. As such, we therefore review the contribution of small- and
medium-sized enterprises (SMEs) specifically in construction based on the economic censuses of 2014 and 2019, the
two most recent censuses, conducted by the INEGI.
Figure 3a.1 NUMBER OF ESTABLISHMENTS
(THOUSANDS OF UNITS)
Figure 3a.2 VALUE ADDED
(CONSTANT MXN BILLIONS)
Source: BBVA Research based on data from INEGI Economic Censuses
Source: BBVA Research based on data from INEGI Economic Censuses
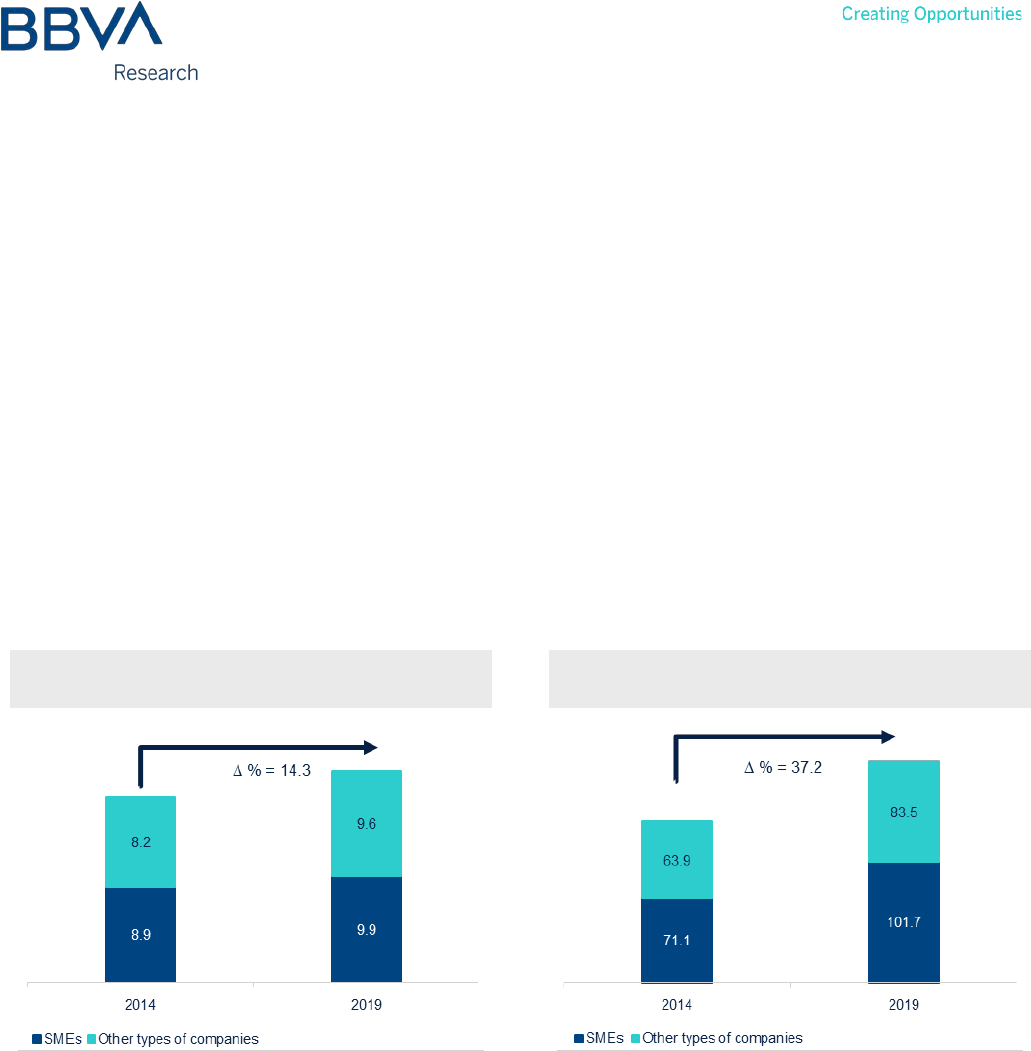
From 2014 to 2019, the number of establishments in construction was up 14.3%; while SMEs increased 11.3% in the
five-year period, or 2.2% on average each year. In proportional terms, there was no significant change. The share of
SMEs in construction fell from 51.9% to 50.5% in the same period. By contrast, SMEs increased their contribution to
the value added of the sector over this five-year period, by 43% or an average annual growth rate (AAGR) of 7.4%.
SMEs, without the number of establishments increasing more than other types of companies, have significantly
increased their contribution to the value added of the sector. This means that, compared to other companies, their
productivity has increased. As the size of the sector has reduced, so has its scale, creating a more favorable space for
Mexico Real Estate Outlook. Second half 2020 24
SMEs. One example of this may precisely be the building sub-sector, whose main type of work, housing, has
decreased in scale.
Figure 3a.3 NUMBER OF ESTABLISHMENTS 2019
(STATE DISTRIBUTION)
Chart 3a.4 VALUE ADDED 2019
(STATE DISTRIBUTION)
Source: BBVA Research based on data from INEGI Economic Censuses
Source: BBVA Research based on data from INEGI Economic Censuses
A regional perspective also shows how the value added provided by SMEs is better distributed throughout the country
than the number of establishments of this size of company. The concentration of units is highest in states with large
cities and major state economies such as Mexico City, Nuevo León and Jalisco, for example. By changing the number
of establishments to value added, the map becomes more blurred and, while concentration still exists, it is less
pronounced and smaller state economies gain part of that value added.
Figure 3a.5 SME VALUE ADDED 2014
(CONSTANT MXN BILLIONS)
Figure 3a.6 SME VALUE ADDED 2019
(CONSTANT MXN BILLIONS)
Source: BBVA Research based on data from INEGI Economic Censuses
Source: BBVA Research based on data from INEGI Economic Censuses
Mexico Real Estate Outlook. Second half 2020 25
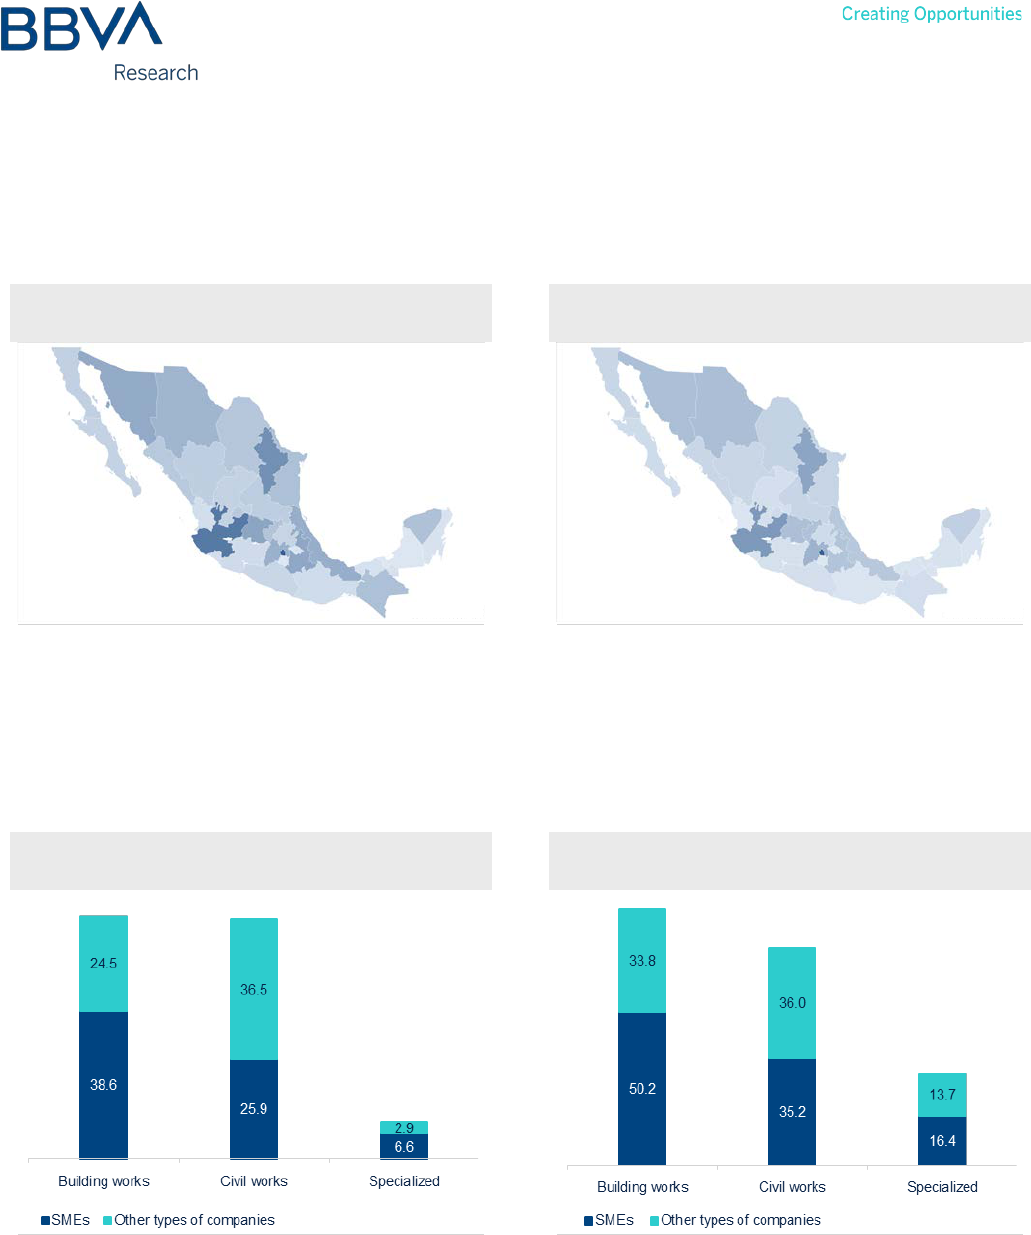
During the review period, building GDP grew while civil engineering GDP fell. However, the value added by SMEs in
both sub-sectors did increase in terms of amount and share. The value added by SMEs in building shows an AAGR of
5.4%, with their share falling from 61.2% to 59.8%. As for civil engineering, SMEs increased value added at an
average annual rate of 6.3%, raising their contribution from 41.5% to 49.4% within the sub-sector.
Figure 3a.7 BUILDING SME INDICATORS
(% CHANGE)
Figure 3a.8 CIVIL ENGINEERING SME
INDICATORS
(% CHANGE)
Source: BBVA Research based on data from INEGI Economic Censuses
Source: BBVA Research based on data from INEGI Economic Censuses
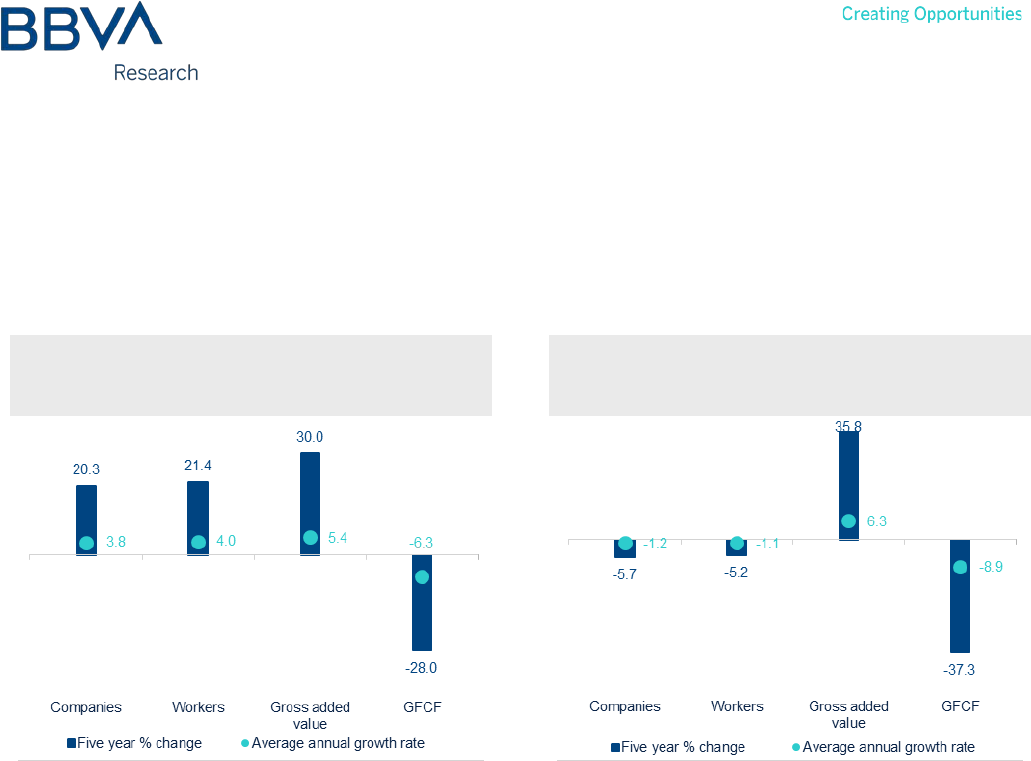
Overall, the main building indicators improved over the five-year analysis period despite the contraction of construction
from a GDP perspective. Of the most important indicators, Gross Fixed Capital Formation (GFCF) was the only
indicator to fall during this period. This coincides, especially from 2018 to date, with a widespread decline in investment
in the Mexican economy and even more so in construction in particular. On the contrary, the main SME indicators in
civil engineering recorded a decline, as did this sub-sector's GDP, except for the value added as indicated above.
Value added has increased in both sub-sectors, as has the average value added per economic unit or establishment.
Again, this points to improved efficiency of SMEs in the sector.
Financing remains the task ahead for SMEs
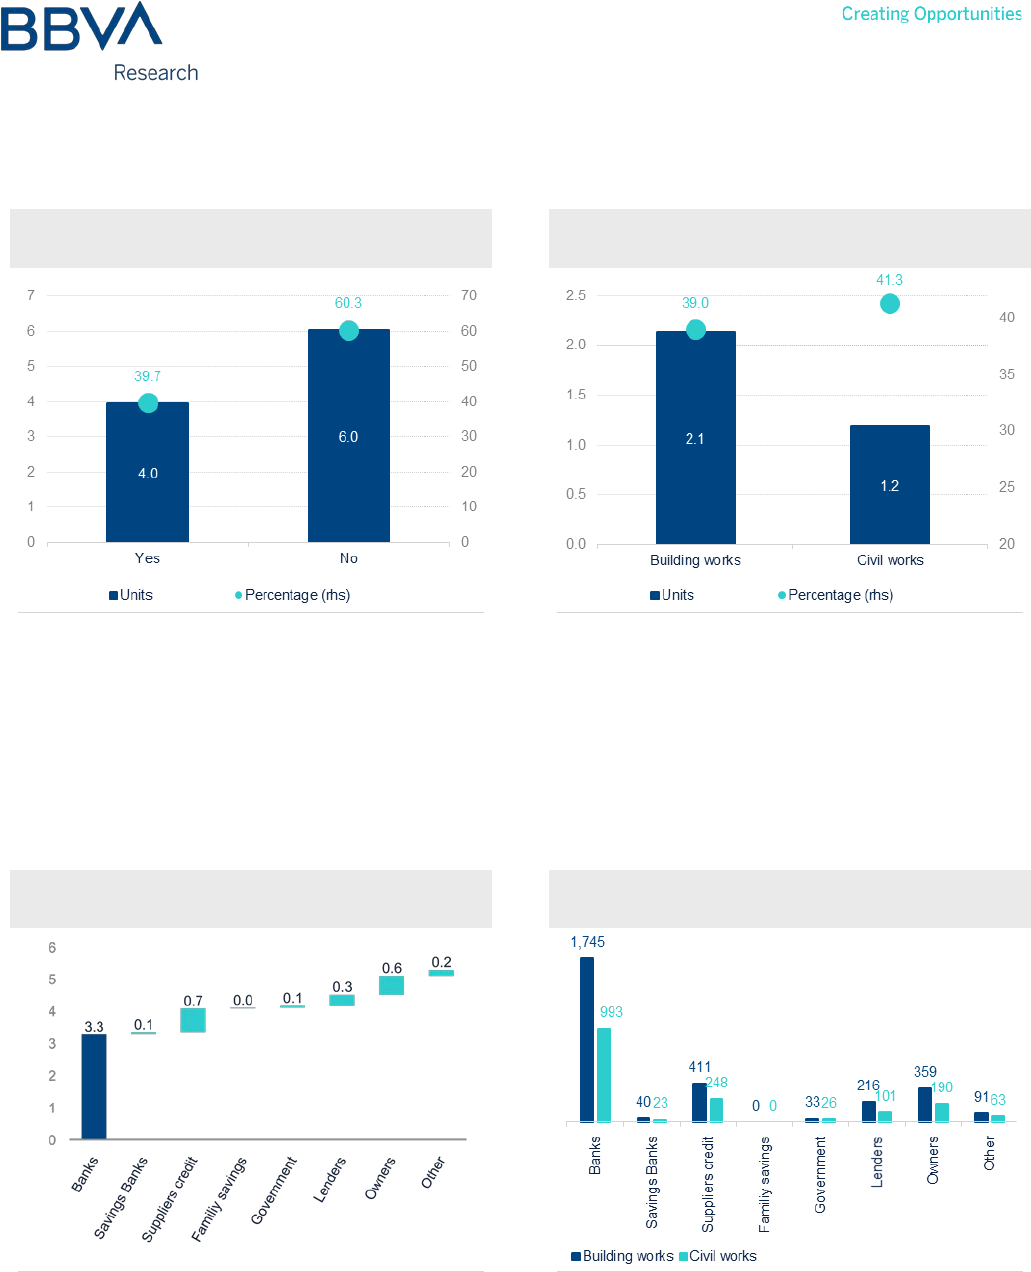
Given the relative growth of SMEs in construction, financing demand should increase. However, there is still
considerable room for improvement when it comes to access to this financing and from formal sources. According to
the 2019 economic census, only 40% of SMEs in construction obtained financing considering all available sources. By
sub-sector, 39% of SMEs in building and 41% of those in civil engineering were granted some form of credit.
The lifespan of SMEs and their involvement in the formal sector of the economy are often the main barriers to obtaining
credit in financial markets. Other factors that impact this are the low use of collateral or guarantees for lower amounts
of investment in physical capital and limited knowledge of banking alternatives. In the first two points, the role of
economic policy, for example through formalization, would have a mostly positive effect on the viability of such
companies. In the second group of factors, the financial system has a greater role to play in terms of making credit
viable.
Mexico Real Estate Outlook. Second half 2020 26
Figure 3a.9 ACCESS TO FINANCING 2019
(THOUSANDS OF UNITS AND %)
Figure 3a.10 ACCESS TO FINANCING 2019
(THOUSANDS OF UNITS AND %)
Source: BBVA Research based on data from INEGI Economic Censuses
Source: BBVA Research based on data from INEGI Economic Censuses
The banking system remains the main source of financing for SMEs in the construction sector in terms of the number
of units accessing said financing. Secondly, there is the financing that suppliers provide to these companies, which
does not generally represent cash flow. The longer period for payment of the suppliers has a similar effect, but could
have an impact on higher prices. Thirdly, there are the capital or credit contributions through the owners and
shareholders themselves. This order of precedence is maintained when broken down by sub-sector. Bank credit is the
main source of financing for SMEs in both building and civil engineering, followed by suppliers and owners or
shareholders. The number of SMEs that use lenders has not reduced and may be a risk factor for their financial health.
Figure 3a.11 SOURCE OF FINANCING 2019
(THOUSANDS OF UNITS)
Figure 3a.12 SOURCE OF FINANCING 2019
(THOUSANDS OF UNITS)
Source: BBVA Research based on data from INEGI Economic Censuses
Source: BBVA Research based on data from INEGI Economic Censuses
Mexico Real Estate Outlook. Second half 2020 27
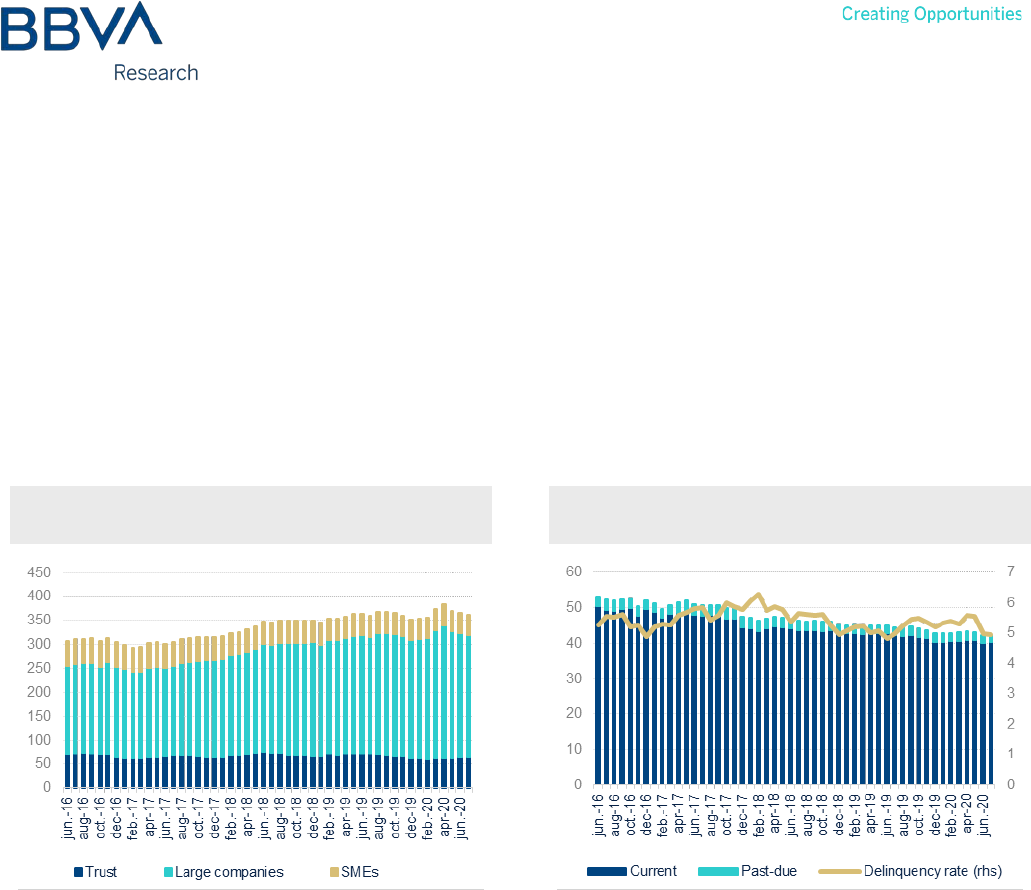
Based on information from the CNBV (Comisión Nacional Bancaria y de Valores — National Banking and Securities
Commission), the credit balance of SMEs in construction has the lowest share with respect to large companies and
trusts. The balance of the SME portfolio in mid-2020 stands at MXN 42.4 billion. This amount has fallen since April,
reflecting the decline in the rest of the economy due to ceased activities in response to the health emergency.
However, when compared to the MXN 53.2 billion recorded in June 2016, the reduction in this portfolio is 20.3%.
Despite the above, bank credit to SMEs remains healthy. Delinquency is around 5% so far this year and has not
exceeded 7% in the last five years. We attribute this result to the high origination standards across banking as a whole
for this company segment, and also to the low penetration, whereby risks are mitigated. In any case, we estimate a
further decline before the end of 2020, but hope that it will not continue throughout 2021 depending on how long it
takes for the economy in general, and this sector in particular, to recover.
Figure 3a.13 CONSTRUCTION CREDIT BALANCE
(MXN BILLIONS)
Figure 3a.14 CONSTRUCTION CREDIT BALANCE
(MXN BILLIONS AND %)
Source: BBVA Research based on CNBV data
Source: BBVA Research based on CNBV data
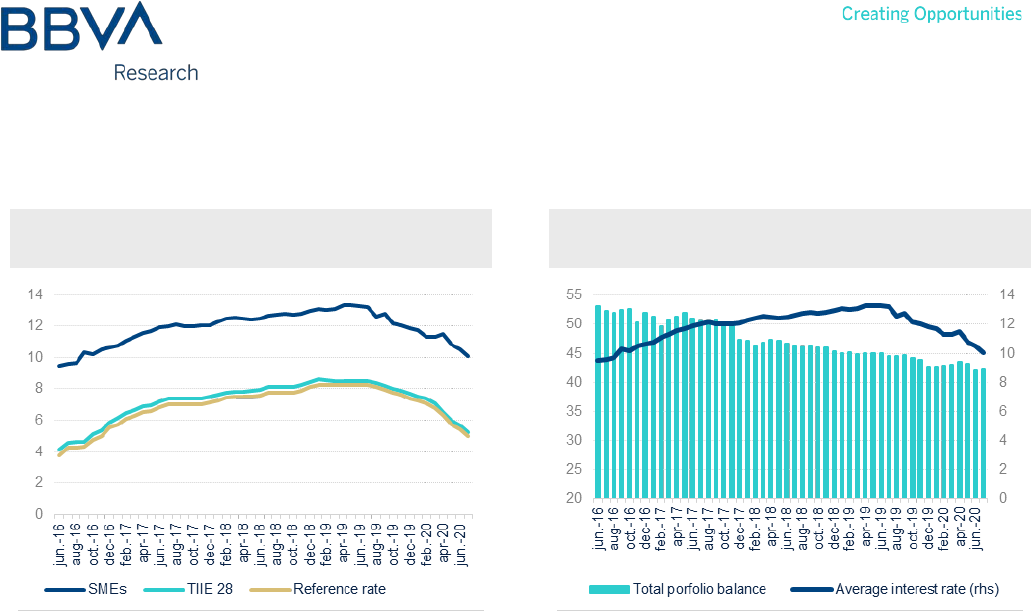
The easing of monetary policy by the central bank has led to lower reference rates. At the close of this report, the
target rate was already below 5%. This has led the interbank interest rate to follow the same trend and fall
proportionately, closely mirroring what happened in mid-2016. The cost of financing for SMEs has therefore also
reduced, as we can see for these companies in construction.
However, the lower cost of credit has not led to higher demand by these companies and the credit balance has fallen
as indicated. In what can be compared to a "liquidity trap" effect, higher availability, measured by its lower cost, has
failed to boost construction activity or investment. It is clear that the dominant effect is the lack of demand for products
in this sector, as well as economic uncertainty.
Mexico Real Estate Outlook. Second half 2020 28
Figure 3a.15 INTEREST AND REFERENCE RATES
(ANNUAL RATE)
Figure 3a.16 SME CREDIT AND INTEREST RATE
(MXN BILLIONS AND ANNUAL RATE)
Source: BBVA Research based on Bank of Mexico and CNBV data
Source: BBVA Research based on CNBV data
Time to innovate to increase credit flow to SMEs
One of the structural changes occurring in construction is the greater importance of SMEs. This trend can be seen in
the medium and long term in various indicators such as the number of units, employment, output and value added.
This dynamic is set to continue for as long as the sector remains stagnant and also due to the practice of segmentation
in larger works. The sustainability of SMEs will therefore be a requirement for the efficiency and recovery of
construction and its sub-sectors.
In addition to increased demand for certain types of work such as housing, industrial buildings and infrastructure to
name a few, improving the viability of SMEs will be essential for a return to growth. For example, by including SME
viability in formality and in the most dynamic value chains. This, in turn, will help in gaining more access to sources of
formal financing for the various uses that are required, including working capital and investment. In terms of banking,
innovation is required in designing products that help in these efforts; more in an environment where digital markets will
become the common factor.

Mexico Real Estate Outlook. Second half 2020 29
3b. The structural dynamics of housing prices in Mexico
Introduction
In our previous issue of Mexico Real Estate Outlook, we presented a comparative analysis of the crises or recessions
experienced by the mortgage market. In this study, we highlighted the main supply and demand factors that have
affected the business cycle of this sector over the past twelve years. One of the indicators that most closely reflects the
stages of the real estate cycle is the housing price index.
In light of the economic crisis triggered by the COVID-19 pandemic, the mortgage financing market is facing one of its
greatest challenges. The contraction in demand will undoubtedly be one of the most significant in modern history and,
as such, we therefore consider it essential to discern in this section the short- and medium-term effects that such a
crisis could have on the value of housing in Mexico.
The evolution of house prices in the face of demand shocks
As already analyzed in the Market Conditions section of this issue, the housing price index developed by the SHF
(Federal Mortgage Company) was first published in 2009, right in the middle of the economic crisis that hit the
mortgage market hard for a full year and a half.
Since then, the SHF has updated the base year of the index twice so as to accurately reflect changes in consumer
preferences and incorporate new characteristics that consumers acquire over time into the value of housing. While the
first version of the index comprised almost 80% social housing, the 2017 base year index, published in the first quarter
of 2019, consisted of 50% social housing with the rest accounted for by mid-range and residential segments. This
indicator should be considered the most representative for Mexico, as it is estimated using the National Appraisals
Database, following the regulatory guidelines established by the SHF.
Differences in the composition of the index are key to understanding the role and magnitude of supply and demand
factors in housing finance cycles and in periods of recession and/or crisis in particular. In a competitive market context,
for any normal good, provided that more of said good is demanded, its price tends to increase and vice versa.
In the case of housing prices, the index would need to reflect more or fewer housing sales. While not all transactions
are carried out through a mortgage loan, around 80% are, so the origination of mortgage financing by commercial
banks is an indicator of market demand.
3
3: While commercial banking mortgage financing accounts for 50% of the total credit granted, we omit the activities of housing institutes from this
analysis to avoid reflecting public policy decisions outside of market performance.
Mexico Real Estate Outlook. Second half 2020 30
Figure 3b.1 SHF HOUSING PRICE INDEX (YoY % CHANGE)
Source: BBVA Research based on SHF data
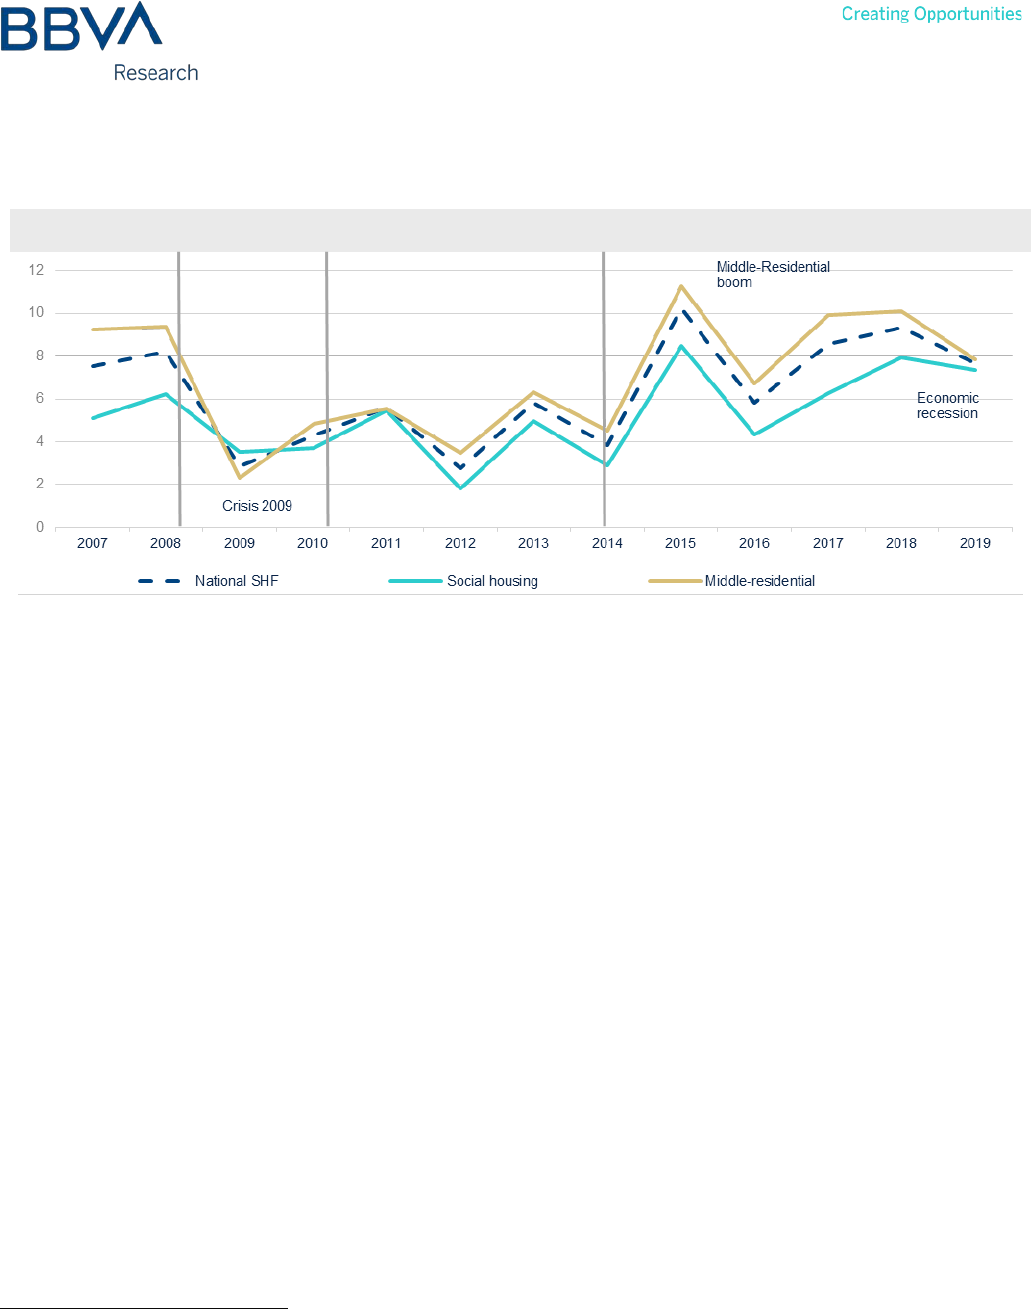
During the 2006–2008 real estate boom, the overall housing price index appreciated at annual rates of between 7.5%
and 8.2%, where the subindex for the mid-range residential segment reached rates above 9%. Meanwhile, the price of
affordable housing, which, as we have already mentioned, accounted for the majority of transactions, appreciated at a
rate of 6.2% before the 2009 crisis.
While the 2009 crisis formally began following the Lehman Brothers bankruptcy in October 2008, it would take a few
months for the Mexican market to feel the effects. Indeed, the slowdown in housing prices became evident in the
course of 2009, closing the year with an appreciation of only 2.8%.
On that occasion, the real estate market would be affected mainly by a demand shock, where mortgage financing
origination contracted to 36% in nominal terms (40.3% in real terms).
4
The drop in demand for mortgage loans was in
turn explained by the contraction in formal employment, measured by the number of workers insured at the IMSS.
Between November 2008 and December 2009, just over half a million formal jobs were lost. Although the number of
IMSS insured workers began to recover in January 2010, demand for mortgage loans would not move into positive
ground until almost a year later, due to the lag effect between these two variables, as previously documented in
several editions of Mexico Real Estate Outlook.
4: Constant prices updated using the SHF Base Price Index 2017=100.
Mexico Real Estate Outlook. Second half 2020 31
Figure 3b.2 HOUSING PRICES AND MORTGAGE
FINANCING AMOUNT (YoY % CHANGE)
Figure 3b.3 IMSS EMPLOYMENT AND MORTGAGE
FINANCING AMOUNT (YoY % CHANGE)
Source: BBVA Research based on CNBV and SHF data
Source: BBVA Research based on CNBV and IMSS data
In Figure 2, we can see that the acceleration of housing prices recovered months after recovery in mortgage origination
was consolidated, following a stable trend between 2011 and 2013. Credit demand experienced a strong rebound from
2014, caused by the sharp drop in mortgage interest rates.
Figure 3b.4 MORTGAGE RATE (%, YoY NOMINAL)
Source: BBVA Research based on Banxico data
In Figure 3, we see that following the 2008–2010 crisis, demand for mortgage loans was driven by a marginal decline
in mortgage rates in mid-2013 (Figure 4). However, the decline was not strong enough to stimulate faster growth. In
this regard, job recovery played a key role in consolidating recovery because, as previously mentioned, the
employment formalization programs during those years generated significant growth in the IMSS insured worker
Mexico Real Estate Outlook. Second half 2020 32
register. As such, from 2013, when mortgage interest rates fell sharply, demand for credit experienced strong growth
with greater emphasis on higher-value housing segments.
Thus, as the change in consumer preferences for more expensive housing was reflected from 2015 with much faster
growth in the housing price index, as we saw in Figure 2, this was supported by formal employment growth rates of up
to 5% per year in some periods (Figure 3).
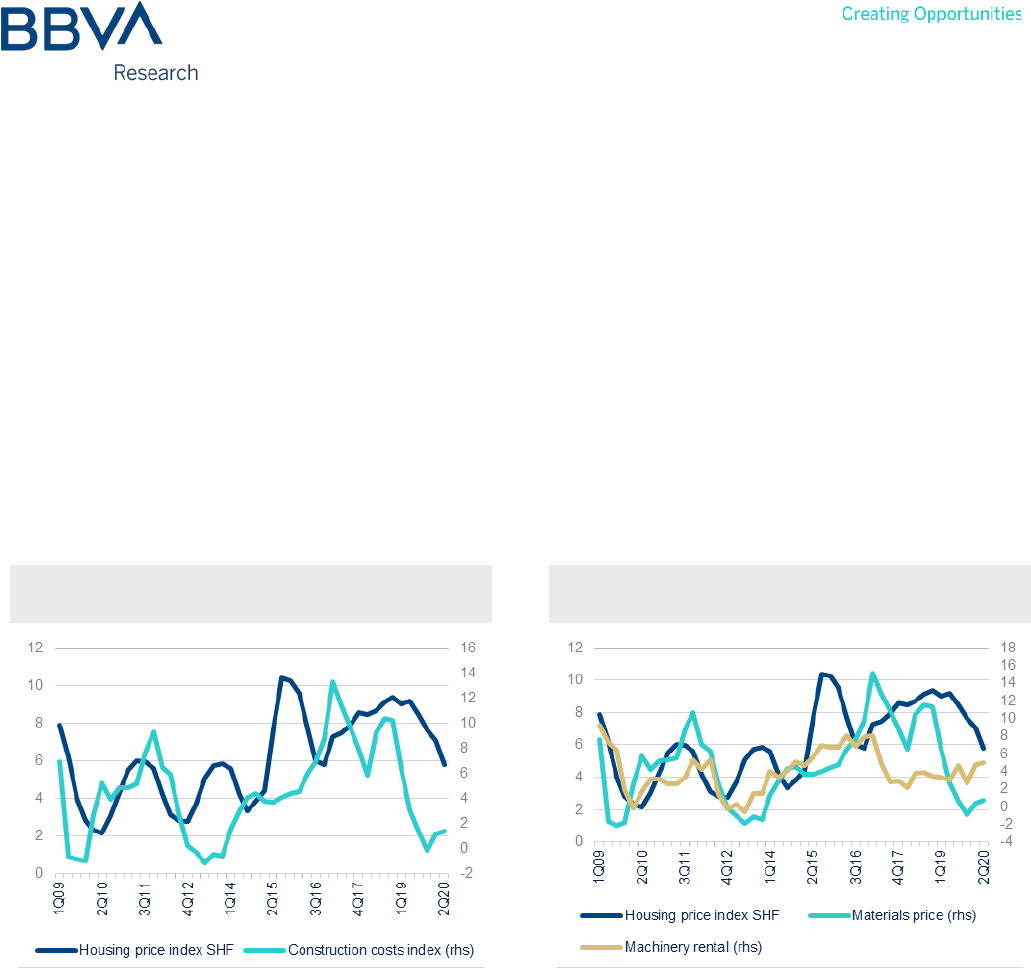
Main supply factors in housing appreciation
In terms of supply, housing prices have reflected the increase in the construction producer price index, mainly from
2014, when the cost of materials such as steel and concrete began to rise steadily. In the years immediately following
the 2009–2010 crisis, prices of materials and machinery rental had recorded very similar appreciation rates that aligned
more closely with the housing appreciation cycles.
Figure 3b.5 SHF AND INPP CONSTRUCTION PRICE
INDEX (YoY % CHANGE)
Figure 3b.6 SHF AND INPP CONSTRUCTION PRICE
INDEX (YoY % CHANGE)
Source: BBVA Research based on SHF and INEGI data
Source: BBVA Research based on SHF and INEGI data
From 2014, in response to the surge in demand in 2013 and the expectation that mortgage rates would continue to fall,
material prices began to record increasingly higher growth rates and the construction model shifted to focus on building
more-expensive houses. Conversely, the machinery rental subindex experienced periods where the exchange rate
depreciated, which affected the cost of rental, as the majority of builders do not own the machinery they use.
Mexico Real Estate Outlook. Second half 2020 33
Figure 3b.7 HOUSING ACQUISITION
SUBSIDIES
(CONSTANT MXN BILLIONS AND % CHANGE)
Figure 3b.8 HOUSING CONSTRUCTION RECORDS
IN THE RUV
(THOUSANDS OF UNITS AND YoY % CHANGE)
Source: BBVA Research based on CONAVI data
Note: Data from 2Q20.
Source: BBVA Research based on RUV data
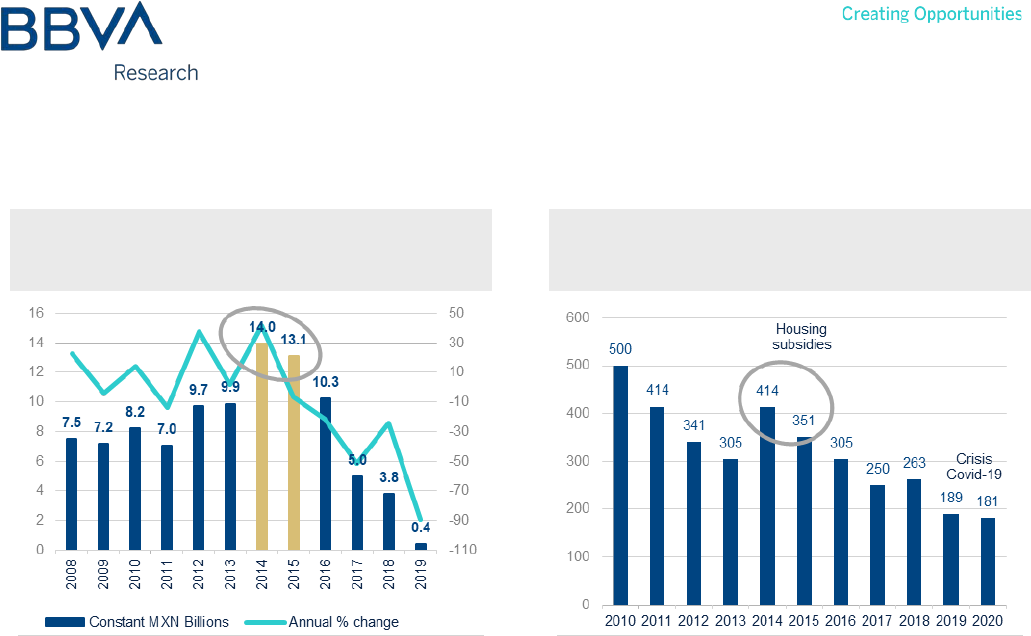
Finally, federal government subsidies for the acquisition of new housing also constituted a major supply shock between
2014 and 2016, at a time when the number of housing construction projects also recovered. Subsequently, the number
of units to be built stabilized at around 250,000 units and we are already seeing contractions of around 20% in the
second quarter of 2020. As discussed in other issues of Mexico Real Estate Outlook, we believe that this generated a
negative factor, because although it revived demand for housing, this was not necessarily the result of real activity in
the economy and may have prolonged the last cycle of housing appreciation, which, since last year, has already shown
obvious adjustments for lower employment generation. This is a consequence of the contraction in GDP and is
accentuated by the crisis caused by the pandemic in 2020.
Analysis of housing-price sensitivity in Mexico
In the final part of this section, we provide an analysis of the determinants of housing prices in Mexico with a model that
allows us to establish the importance of each supply and demand factor. In terms of demand, we have seen that
mortgage loans are the main determinant. However, the fact that mortgage loans evolve based on formal employment
means that the effects must be estimated through a system of non-simultaneous equations. The econometric estimate
would therefore be provided by the following dynamic specification:
=
+
+
+
(1)
=
+
+
(2)

Mexico Real Estate Outlook. Second half 2020 34
Whereby:
= The SHF housing price index
= Mortgage financing originated by commercial banking in MXN billions
= The national construction producer price index
= The number of IMSS insured workers
= The interest rate for mortgage loans from the Bank of Mexico
,
are the error margins of equations (1) and (2).
5
All variables are expressed in annual growth rates to obtain the housing price elasticities of each variable and are
stationary on a quarterly basis, whereas the expression t-n represents the number of lags. As such, expressions (1)
and (2) indicate that housing prices are determined by their lagging dynamics, the origin of commercial bank mortgage
loans, the construction producer price index and a stochastic error term. In turn, the demand component, estimated
based on mortgage financing origination, is determined by the number of workers in the IMSS and the commercial
banking mortgage rate. The effect of our demand equation is therefore represented in the price function by a partial
change. The short-term effects are therefore provided by the expressions in the following table.
Table 3b.1 SHORT-TERM EFFECTS
=
=0.018
=
=0.095
×
=
×
= 0.047
×
=
×
= -0.011
=
= 2.51
=
= -0.60
Note: Percentage change in prices for each percentage point of change in each of the explanatory variables, considering the rest to be constant.
Source: BBVA Research
5: The system of equations is in accordance with the convergence conditions, the corresponding co-integration tests and the assumptions of the
data-generating process.

Mexico Real Estate Outlook. Second half 2020 35
According to Table 1, the effect of demand for mortgage financing and construction costs positively affect housing
appreciation. The parameters therefore satisfy the condition
and
> 0. However, the effect of employment and the
interest rate is provided by a cross-derivation, in which it is fulfilled in the same way as
×
> 0, because the higher
the growth of employment, the greater the demand for housing and, simultaneously, the greater the appreciation of
houses. Finally the mortgage interest rate effect would also be provided by a cross-effect, in which
×
< 0,
because the greater the interest rate, the lower the demand for mortgage financing and, by extension, the lower the
appreciation.
The result of the demand equation indicates that, in the short term, for each percentage point by which employment
increases, the amount of mortgage financing increases by 2.5%, while the cross-effect on housing prices is 0.04%.
Although the short-term effect on prices is small, this is due to the lag effect that occurs, as discussed at the beginning
of this article. In the long term, however, the effect increases to 0.22%.
Furthermore, for each percentage point by which the mortgage interest rate increases, demand for mortgage loans
decreases 0.60% in the short term. Similarly, the cross-effect on prices is small, at -0.01% in the short term, whereas,
in the long term, sensitivity is -0.05% for each percentage point.
Table 3b.2 LONG-TERM EFFECTS
(1
)
= 0.075
(1
)
= 0.386
(1
)
×
(1
)
= 0.225
(1
)
×
(1
)
= -0.054
(1
)
= 2.98
(1
)
= -0.713
Note: Percentage change in prices for each percentage point of change in each of the explanatory variables, considering the rest to be constant.
Source: BBVA Research
As we can see in Table 2, the sensitivity of housing prices to any change in their determinants is greater in the long
term, as the cross-effect of demand (as measured by mortgage financing origination) has a delayed effect on the price
market.
Construction costs stand as the main determinant, since for each percentage point by which these costs increase,
prices rise 0.38%. After that, formal employment is the second factor with the greatest impact on housing prices. For
each percentage point by which employment increases, house prices rise 0.22%.

Mexico Real Estate Outlook. Second half 2020 36
Conclusions
Housing prices in Mexico have experienced two boom periods in recent history, both of which have preceded an
economic crisis. Following the 2006–2008 boom, where appreciation rates hovered around 8% per year, the 2009
crisis erupted. The contraction of the mortgage market in those years as a result of job losses further explained the
slowdown in price growth, the minimum appreciation of which was reached during 2009 at rates of around 2% per year.
Recovery took around a year and a half to see a revival in mortgage financing demand and, in turn, prices, which rose
steadily between 2011 and 2013. In subsequent years, the change in the consumer profile, low mortgage interest
rates, job recovery and, momentarily, public policies that granted subsidies in excess for the acquisition of new homes,
boosted the purchase of increasingly higher-value homes.
The structural change became apparent in 2014 and, since then, in addition to employment, construction costs have
begun to impact appreciation cycles more strongly. These are the reasons as to why, during the current economic
crisis (which actually began last year and was aggravated by the COVID-19 pandemic), the effect of job losses, which
exceeds that experienced in 2009, has also resulted in a slowdown in input prices. This is a consequence of the fall in
the number of construction projects.
The results of the estimated model confirm the importance of employment and input costs on the trend outlined by the
housing price index, which has continued to grow and which we hope will continue to do so, albeit at lower rates.
Recovery in appreciation rates may take some time as, although mortgage interest rates are experiencing significant
declines and the construction input price is low, formal employment, the main determinant of housing demand, could
take two or three years to recover its pre-crisis level. The effect will therefore not be visible on prices in the short term,
due to the lag effect toward the mortgage market.

Mexico Real Estate Outlook. Second half 2020 37
4. Statistical Annex
Table 4.1 ANNUAL MACROECONOMIC INDICATORS
2012
2013
2014
2015
2016
2017
2018
2019
2020e
Real GDP (Annual % change)
3.6
1.4
2.8
3.3
2.6
2.1
2.2
-0.3
-10.0
Real private consumption (Annual % change)
2.3
1.8
2.1
2.7
3.7
3.2
2.4
0.4
Real government consumption (Annual % change)
3.4
0.5
2.6
1.9
2.6
0.7
2.8
-1.4
Real construction investment (annual % change)
2.1
-5.3
2.0
1.2
-0.8
-2.2
-0.5
-3.7
Residential
1.4
-5.0
3.2
3.7
4.2
1.9
1.1
-1.6
Non-residential
2.7
-5.5
1.2
-0.7
-4.8
-5.7
-2.0
-5.8
Total formal private employment (IMSS)
Thousands of persons (average, sa)
15,899
16,418
17,032
17,751
18,431
19,244
19,988
20,427
Annual % change
4.7
3.3
3.7
4.2
3.8
4.4
3.9
2.2
Average salary (IMSS)
Nominal pesos per day, average
270.8
281.5
294.1
306.4
317.9
333.2
352.2
375.7
Real annual % change
0.0
0.1
0.4
1.4
0.9
-1.1
0.8
2.9
Real total wages (IMSS, annual % change)
5.1
3.6
4.0
5.8
4.8
3.2
4.9
5.3
Minimum general salary (daily)
Nominal pesos
60.5
63.1
65.6
69.2
73.0
80.0
88.4
102.7
Real annual % change
-0.1
0.4
-0.1
2.8
2.6
3.1
5.5
12.2
Consumer prices (eop, annual % change)
3.6
4.0
4.1
2.1
3.4
6.8
4.8
2.8
TIIE 28 average (%)
4.8
4.3
3.5
3.3
4.5
7.1
8.0
8.3
10-year interest rate, Govt. bond (M10)
5.7
5.7
6.0
5.9
6.2
7.2
8.0
7.5
Source: BBVA Research with Banco de Mexico, Conasami, Inegi & IMSS data
Table 4.2 ANNUAL CONSTRUCTION AND HOUSING INDICATORS
2012
2013
2014
2015
2016
2017
2018
2019
2020e
Real construction GDP (annual % change)
2.6
-1.5
2.6
2.1
1.7
-0.3
0.5
-4.9
-19.2
Building
2.9
-3.0
3.3
2.9
3.9
1.0
1.3
-3.0
-19.7
Civil engineering and major works
0.7
3.0
-1.9
-0.2
-8.9
-9.5
-5.8
-6.0
-17.1
Specialized construction work
4.2
-2.2
8.6
2.6
10.4
7.2
5.4
-12.8
-19.4
Total construction employment (IMSS)
Thousands people, average
1,275.2
1,289.8
1,383.5
1,504.0
1,537.1
1,602.4
1,682.6
1,656.3
Annual % change
6.3
1.1
7.3
8.7
2.2
4.2
5.0
-1.6
Hydraulic cement sales (tons, annual % change)
2.1
-2.7
5.3
7.5
2.8
1.1
0.8
-6.9
Construction companies
1
Real production value (annual % change)
Total
3.4
-4.9
-0.5
-0.2
-3.2
-1.3
-2.7
-8.1
Building
2.0
-7.9
3.9
-2.9
2.6
2.7
-7.3
-4.3
Public works
0.5
-8.0
-5.2
4.7
-8.1
-8.7
-4.2
-6.8
Water, irrigation and sanitation
1.9
-13.5
-3.9
-11.2
4.5
-7.5
11.8
-14.3
Electricity and communications
-6.8
10.2
-10.4
5.3
13.9
-2.5
-1.1
-10.0
Transportation
-2.7
-12.9
-1.3
-4.7
-2.3
1.4
-7.9
-9.5
Oil and petrochemicals
14.7
-3.9
-11.0
36.0
-34.5
-42.3
-5.2
17.6
Other
36.4
29.3
2.4
-9.1
-4.3
12.7
20.7
-23.1
Construction prices (annual % change)
Headline
0.4
-0.7
6.5
2.3
8.7
7.9
10.3
-0.1
Construction materials
-0.2
-1.4
4.5
4.5
9.8
8.7
11.3
-0.9
Labor
3.2
2.9
3.5
4.2
2.9
4.4
5.3
4.9
Equipment rental
-0.2
1.4
4.1
7.8
7.9
3.0
3.4
2.6
1: Considers companies affiliated and not affiliated to the Mexican Chamber of the Construction Industry.
Source: BBVA Research with Banco de Mexico, Conasami, Inegi, IMSS, Infonavit and Fovissste data

Mexico Real Estate Outlook. Second half 2020 38
Table 4.3 ANNUAL HOUSING CREDIT INDICATORS
2012
2013
2014
2015
2016
2017
2018
2019
2020*
Number of loans granted (thousands)
Total
607.0
583.7
609.4
599.2
572.3
565.4
545.6
519.8
494.4
Infonavit
421.9
380.6
387.0
393.0
369.1
388.8
370.8
335.1
323.1
Fovissste
64.3
65.9
63.1
64.4
63.4
51.6
48.7
48.9
49.7
Commercial banks and Sofomes
120.7
137.1
159.3
141.8
139.7
124.9
126.1
135.8
121.5
Reduction**
45.4
58.7
82.5
56.6
51.1
36.8
29.4
36.1
27.3
Individual credits
561.6
525.0
527.0
542.6
521.2
528.6
516.2
483.7
467.0
Financing flow
1
Total
387.7
382.6
420.5
426.1
411.5
393.5
402.7
404.4
376.4
Infonavit
186.4
160.6
170.6
171.8
155.8
168.7
166.0
163.2
154.1
Fovissste
55.5
54.9
59.4
57.3
54.9
42.3
38.7
36.9
37.0
Commercial banks and Sofomes
145.8
167.2
190.5
197.0
200.8
182.4
198.0
204.3
185.2
Commercial banks current loan portfolio
Balance end of period
1
605.7
627.8
653.9
719.4
778.7
795.3
819.2
872.4
902.6
Delinquency rate (%)
3.1
3.5
3.3
2.8
2.4
2.5
2.5
2.8
3.0
Notes: Between 2011 and 2016, data do not considers Sofoles/Sofomers. As of 2008, the SHF index of housing prices is used as a price deflator.
* Annualized to June 2020. Billions of constant pesos of June 2020.
** It refers to financing (loans and grants) that are considered in two or more institutions. Do not considers “Infonavit Total” nor Second loan granted by the Infonavit.
Source: BBVA Research with Banco de Mexico & CNBV data
Table 4.4 SHF QUARTERLY HOUSING PRICE INDEX BY STATE (ANNUAL % CHANGE)
3Q17
4Q17
1Q18
2Q18
3Q18
4Q18
1Q19
2Q19
3Q19
4Q19
1Q20
2Q20
National
7.9
8.6
8.4
8.7
9.0
9.3
9.0
9.2
8.4
7.7
7.0
5.8
Aguascalientes
7.9
8.5
8.3
8.3
8.4
8.2
7.9
8.3
8.3
8.3
7.8
6.5
Baja California
7.0
8.2
8.7
9.1
9.5
9.6
8.9
9.0
9.1
8.8
8.4
7.5
Baja California Sur
6.3
7.0
7.6
8.2
9.1
10.1
9.5
9.5
9.3
8.6
8.5
7.8
Campeche
7.1
8.3
8.6
8.9
9.3
9.6
8.9
8.7
8.2
7.6
7.3
6.7
Chiapas
6.3
7.3
7.5
8.1
8.4
8.4
7.8
7.4
7.2
6.9
6.6
5.9
Chihuahua
6.2
6.5
6.4
6.8
7.5
8.3
8.0
8.2
7.7
6.9
6.7
6.1
Coahuila
6.7
6.7
6.5
6.8
7.5
8.4
8.3
8.7
8.1
7.3
7.0
6.2
Colima
7.2
8.3
8.5
8.8
9.2
8.9
8.5
8.7
8.1
7.7
7.0
6.1
Durango
5.1
5.7
5.8
6.6
7.1
7.3
7.0
6.6
6.2
6.0
5.9
5.8
Guanajuato
7.8
9.0
9.1
9.6
9.9
9.7
9.4
9.3
8.6
8.1
7.2
6.3
Guerrero
6.8
7.3
7.3
7.7
7.9
8.0
7.3
7.2
6.7
6.6
6.3
5.3
Hidalgo
5.8
5.9
5.9
6.7
7.5
7.9
7.6
7.7
7.2
6.5
5.9
4.9
Jalisco
8.9
10.7
10.9
11.3
11.2
11.4
11.1
11.3
11.0
10.2
9.3
8.0
México
7.0
7.7
7.7
8.3
8.6
8.3
7.5
7.2
6.6
6.6
6.4
5.4
Mexico City
12.2
12.5
11.3
10.5
10.4
11.0
11.5
12.1
9.8
7.2
5.5
1.9
Michoacán
6.9
7.9
8.0
8.8
9.0
8.8
8.6
8.2
7.9
7.8
6.9
6.1
Morelos
6.5
6.6
6.6
7.3
8.1
8.6
7.9
7.8
7.2
6.8
6.6
5.3
Nayarit
8.4
8.8
8.4
8.4
9.3
10.1
10.0
10.3
9.6
8.4
7.7
6.8
Nuevo León
8.8
9.7
9.6
9.6
10.0
9.9
9.4
9.5
8.6
8.0
7.6
6.8
Oaxaca
6.6
8.1
8.3
8.4
8.3
7.8
7.1
7.1
7.0
6.7
6.5
5.8
Puebla
7.8
8.9
9.0
9.3
9.5
9.4
8.7
8.5
8.3
7.9
7.5
7.0
Querétaro
7.0
7.7
7.9
8.4
8.7
8.6
7.8
7.6
7.2
7.3
7.1
6.1
Quintana Roo
7.3
6.4
6.4
6.7
8.5
10.8
11.0
11.8
11.2
9.2
8.3
6.8
San Luis Potosí
7.7
8.4
8.5
9.1
9.6
9.7
9.4
9.0
8.1
7.4
7.0
6.9
Sinaloa
7.5
8.3
8.3
8.6
9.1
9.3
9.4
9.8
9.6
9.2
8.4
7.4
Sonora
5.9
5.9
5.8
6.1
6.7
7.2
7.0
7.7
7.7
7.6
7.7
7.1
Tabasco
6.3
7.8
8.1
8.8
8.7
8.1
7.2
6.4
6.1
6.2
6.1
5.7
Tamaulipas
5.6
5.7
5.5
5.9
6.6
7.4
7.3
7.8
7.5
6.8
6.5
5.7
Tlaxcala
7.0
7.3
6.6
6.6
6.6
7.1
6.8
6.6
6.0
4.8
4.6
4.5
Veracruz
5.6
6.1
6.0
6.4
6.8
7.0
6.6
6.5
6.0
5.4
5.3
5.1
Yucatán
7.7
7.6
7.5
7.8
8.7
9.4
9.1
9.4
8.9
8.2
7.8
6.6
Zacatecas
6.6
7.7
7.8
8.1
8.6
8.7
8.2
8.3
7.8
7.0
6.5
5.1
Source: BBVA Research with Sociedad Hipotecaria Federal data

Mexico Real Estate Outlook. Second half 2020 39
Table 4.5 QUARTERLY MACROECONOMIC INDICATORS
3Q17
4Q17
1Q18
2Q18
3Q18
4Q18
1Q19
2Q19
3Q19
4Q19
1Q20
2Q20
Real GDP (annual % change)
1.6
1.8
1.5
3.3
2.8
1.3
1.1
-1.1
-0.4
-0.7
-1.3
-18.7
Real private consum. (annual % chge.)
3.1
2.2
2.4
3.4
2.6
1.3
0.8
-0.4
0.5
0.7
-0.5
-20.6
Real gvmnt. consum. (annual % chge.)
-0.8
0.7
2.9
5.2
2.5
0.5
-0.6
-2.8
-1.7
-0.4
3.4
2.4
Real const.investment (annual % chge.)
-0.7
-1.7
0.4
4.3
-0.9
-5.5
1.0
-6.0
-5.0
-5.0
-7.3
-32.6
Residential
3.3
5.0
7.1
7.4
-3.3
-6.0
2.9
-6.2
-2.7
-0.2
-6.3
-34.9
Non-residential
-4.2
-7.2
-5.4
1.4
1.4
-5.0
-0.8
-5.9
-7.1
-9.5
-8.3
-30.3
Source: BBVA Research with Inegi data
Table 4.6 QUARTERLY CONSTRUCTION AND HOUSING INDICATORS
3Q17
4Q17
1Q18
2Q18
3Q18
4Q18
1Q19
2Q19
3Q19
4Q19
1Q20
2Q20
Real construction GDP
0.6
-0.1
2.9
5.0
-0.3
-5.4
-0.2
-7.0
-6.9
-5.7
-8.2
-34.2
Vol. index 2003=100 (annual % chge.)
Building
2.5
1.4
4.4
6.1
-1.0
-4.2
2.6
-5.8
-5.4
-3.5
-6.3
-35.7
Const. engineering and major works
-9.5
-4.8
-6.7
0.8
-4.0
-13.4
-4.5
-7.3
-3.9
-8.3
-17.5
-31.1
Specialized construction work
5.8
-0.9
8.4
4.9
8.1
0.0
-8.1
-12.5
-17.4
-13.1
-7.5
-30.1
Construction companies
1
Real production value (annual % chge.)
Total
-1.1
-2.3
-1.4
1.5
-2.0
-8.2
-2.9
-8.3
-9.7
-11.3
-16.0
-32.8
Building
4.1
-4.0
-4.0
-4.0
-8.7
-11.8
0.3
-5.0
-6.2
-6.2
-11.6
-34.6
Public works
-10.6
-3.0
-6.0
1.3
-1.4
-9.8
-4.2
-6.1
-4.7
-12.0
-21.3
-33.1
Water, irrigation and sanitation
-2.1
-23.2
10.9
9.8
11.7
14.6
-8.3
-5.1
-18.9
-24.4
-37.0
-45.4
Electricity & communications
-15.3
1.3
-8.7
-6.4
3.9
6.2
-1.7
0.3
-3.1
-29.9
-32.7
-48.9
Transportation
-0.6
5.8
-6.2
2.3
-3.8
-21.4
-9.7
-15.7
-10.3
-1.5
-18.2
-29.2
Oil and petrochemicals
-38.2
-22.1
-15.5
3.2
-8.7
0.7
24.8
31.8
33.1
-10.2
-5.0
-17.5
Other
14.8
7.5
28.9
23.0
21.0
12.0
-9.8
-24.1
-31.9
-24.9
-15.0
-24.8
1: Considers companies affiliated and not affiliated to the Mexican Chamber of the Construction Industry.
Source: BBVA Research with Inegi and Banco de México data
Table 4.7 QUARTERLY HOUSING MARKET INDICATORS
3Q17
4Q17
1Q18
2Q18
3Q18
4Q18
1Q19
2Q19
3Q19
4Q19
1Q20
2Q20
Home sales by organization (thousands of credits)
Infonavit
101.8
110.8
74.7
101.7
98.4
96
66.6
85.9
87.7
94.9
67.1
72.8
Fovissste
12.0
14.3
9.8
13.1
13.1
12.7
9.5
12.5
13.2
13.8
13.7
9.0
Banks
20.9
25.4
20.8
23.9
24.7
27.2
21.3
24.7
24.8
28.8
23.7
16.9
Total
134.7
150.5
105.2
138.7
136.2
135.9
97.4
123.0
125.7
137.6
104.4
98.7
Financing (billions of December 2019 pesos)
Infonavit
46.5
50.4
33.3
45.6
43.6
43.6
33.0
41.7
42.4
46.0
31.8
33.8
Fovissste
10.1
11.2
8.2
10.8
9.9
9.8
7.0
9.6
10.3
10.1
9.9
6.8
Banks
44.2
50.5
41.9
50.7
50.5
54.9
47.0
51.2
51.3
54.7
44.0
35.2
Total
100.8
112.1
83.4
107.1
104.0
108.3
87.0
102.5
104.0
110.8
85.8
75.8
Infonavit: number of credits to buy a house (thousands)
Economic + Popular
2
64.1
68.3
47.8
65.4
62.6
57.0
37.0
49.4
49.0
51.0
35.6
38.0
Traditional
23.5
26.1
16.2
22.1
21.8
23.9
17.0
22.0
23.5
26.5
19.5
22.9
Middle income
10.9
13.0
8.5
11.3
10.8
11.8
9.7
11.2
11.9
13.6
9.3
9.4
Residential
2.8
3.1
1.9
2.6
2.7
2.9
2.4
2.8
2.9
3.3
2.2
2.1
Residential Plus
0.5
0.4
0.3
0.4
0.4
0.4
0.5
0.5
0.5
0.5
0.5
0.3
Total
101.8
110.8
74.7
101.7
98.4
96.0
66.6
85.9
87.7
94.9
67.1
72.8
Note: Price ranges expressed in times the minimum monthly wage (TMMW); Economic and Popular Segment (118-200), Traditional (201-350), Middle income (351-
750), Residential (751-1500) and Plus (1500 and more). MMW=2,046 pesos in 2014 in the “A” zone.
2: Includes new and used homes
Source: BBVA Research with INEGI, Infonavit, Fovissste, Banxico data

Mexico Real Estate Outlook. Second half 2020 40
Table 4.8 QUARTERLY HOUSING CREDIT INDICATORS
3Q17
4Q17
1Q18
2Q18
3Q18
4Q18
1Q19
2Q19
3Q19
4Q19
1Q20
2Q20
Commercial banks current loan portfolio
Delinquency rate (%)
2.4
2.5
2.5
2.4
2.5
2.5
2.5
2.6
2.7
2.8
3.0
3.0
Source: BBVA Research with Inegi, Infonavit, Fovissste, Banxico data
Table 4.9 MONTHLY MACROECONOMIC INDICATORS
J.19
J
A
S
O
N
D
J.20
F
M
A
M
J
IGAE (annual % change)
-1.5
0.4
-1.1
0.0
-0.6
-1.4
0.3
-0.7
-0.5
-2.2
-19.9
-22.7
-13.3
Real constr. vol. (ann. % change)
-7.0
-8.8
-3.1
-8.5
-9.3
-3.7
-3.9
-8.1
-9.0
-7.5
-39.7
-36.8
-26.2
Building
-5.6
-7.3
0.3
-8.7
-9.0
1.0
-2.5
-6.6
-7.5
-4.6
-42.9
-38.2
-26.3
Civil engineering & major works
-6.2
-4.8
-2.3
-4.7
-5.5
-12.7
-6.8
-17.2
-17.2
-18.0
-31.8
-32.4
-29.2
Specialized construction work
-15.0
-20.6
-18.8
-12.1
-15.4
-14.8
-8.2
-5.1
-7.8
-9.4
-33.6
-34.4
-21.5
Total formal private empl. (IMSS)
Thousand people
20,369
20,385
20,422
20,567
20,727
20,804
20,421
20,490
20,614
20,483
19,928
19,583
19,500
Annual % change
2.4
2.2
1.8
1.9
1.8
1.7
1.7
1.6
1.5
0.7
-2.2
-3.9
-4.3
Average salary quote (IMSS)
Nominal daily pesos
376.6
380.7
379.7
374.5
373.2
375.8
378.1
396.2
397.6
399.3
403.6
408.0
407.3
Real annual % change
2.5
2.6
3.3
3.3
3.3
3.5
3.8
3.1
2.6
3.7
5.7
5.1
4.6
Real total wages (IMSS)
Annual % change
5.0
4.9
5.2
5.3
5.2
5.2
5.5
4.7
4.2
4.4
3.4
1.0
0.2
Minimum general wage (daily)
Nominal pesos
102.7
102.7
102.7
102.7
102.7
102.7
102.7
123.2
123.2
123.2
123.2
123.2
123.2
CPI (end of period)
Annual % change
3.9
3.8
3.2
3.0
3.0
3.0
2.8
3.2
3.7
3.2
2.1
2.8
3.3
TIIE 28 (average, %)
8.5
8.5
8.4
8.2
8.0
7.9
7.7
7.5
7.4
7.1
6.5
6.0
5.6
10-year Gov. bond int. rate (M10)
7.6
7.5
7.0
6.9
6.8
7.1
6.9
6.6
6.9
7.1
6.6
6.2
5.8
Source: BBVA Research with Inegi, Banco de México, IMSS data
Table 4.10 MONTHLY CONSTRUCTION AND HOUSING INDICATORS
J.19
J
A
S
O
N
D
J.20
F
M
A
M
J
Const. employment (IMSS)
Total (thousand people)
1,654
1,674
1,676
1,685
1,707
1,695
1,574
1,608
1,627
1,594
1,396
1,364
1,462
Annual % change
-2.1
-2.3
-3.4
-2.9
-2.3
-1.0
-0.8
-1.4
-1.3
-2.7
-15.0
-17.3
-11.6
Hydraulic cement sales (tons)
Annual % change
-6.6
-4.4
-4.2
-11.1
2.4
-4.7
-1.0
4.9
7.5
-0.6
-9.1
-11.4
-0.7
Resid. cons. prices (ann. % chge.)
Headline
3.1
2.0
1.7
1.3
1.0
0.2
-0.1
-0.4
0.3
1.2
2.9
2.0
1.4
Materials
2.7
1.5
1.1
0.6
0.3
-0.6
-0.9
-1.2
-0.6
0.5
2.4
1.4
0.8
Labor
5.4
4.9
5.4
5.0
4.9
4.9
4.9
4.4
5.9
5.2
5.3
4.6
4.5
Machinery rental
3.0
3.8
4.8
4.7
4.4
2.7
2.6
2.4
1.7
4.8
7.7
6.8
4.9
Source: BBVA Research with Banxico, INEGI, IMSS data
Table 4.11 MONTHLY HOUSING CREDIT INDICATORS
J.19
J
A
S
O
N
D
J.20
F
M
A
M
J
Commercial banks loan portfolio
Balance in billion pesos*
853.6
858.3
864.5
869.5
870.6
872.2
872.4
873.1
874.4
882.9
895.6
901.4
902.6
Annual % change
4.8
5.1
6.1
6.0
6.2
6.3
6.5
6.1
5.7
6.0
7.2
6.3
5.7
Total annual cost (CAT, average)
13.3
13.3
13.3
13.2
13.2
13.1
13.0
13.0
13.0
12.8
12.8
12.8
12.8
* June 2020 pesos
Source: BBVA Research with Banco de México, Conasami, INEGI, IMSS, CNBV data

Mexico Real Estate Outlook. Second half 2020 41
5. Special topics included in previous issues
First Half 2020
The mortgage burden is low, but should increase in 2020
FIBRAs and the real estate market in Mexico
Mortgage sector contractions in Mexico
First Half 2019
Real estate services and their economic determining factors
High concentration of demand for bank mortgage credit
Second half 2018
Construction performance below its potential
An approach to the prices faced by builders
Population, lag and employment; their contribution to the state distribution of the mortgage market
First Half 2018
The significance of business expectations in construction
Low mortgage debt of households
First Half 2017
The determining factors of the housing supply in Mexico
Infrastructure still awaits reform effect
Second Half 2016
Commercial building construction and its cycle of appreciation
Rising house prices due to increased costs
First Half 2016
The evolution of housing prices in regional clusters in Mexico
Methodology to assess the spatial dependence of housing prices
Mortgage essential in housing demand
Infonavit maintains credit placement stable
First Half 2015
Drivers of housing prices in Mexico
The significance of consumer expectations in mortgage lending
The Infonavit 2015-19 Financial Plan. Financial soundness and a greater amount of lending are key features
Available in www.bbvaresearch.com in Spanish and English

Mexico Real Estate Outlook. Second half 2020 42
DISCLAIMER
This document and the information, opinions, estimates and recommendations expressed herein, have been prepared by Banco Bilbao Vizcaya
Argentaria, S.A. (hereinafter called “BBVA”) to provide its customers with general information regarding the date of issue of the report and are
subject to changes without prior notice. BBVA is not liable for giving notice of such changes or for updating the contents hereof.
This document and its contents do not constitute an offer, invitation or solicitation to purchase or subscribe to any securities or other instruments, or
to undertake or divest investments. Neither shall this document nor its contents form the basis of any contract, commitment or decision of any kind.
Investors who have access to this document should be aware that the securities, instruments or investments to which it refers may not be
appropriate for them due to their specific investment goals, financial positions or risk profiles, as these have not been taken into account
to prepare this report. Therefore, investors should make their own investment decisions considering the said circumstances and obtaining such
specialized advice as may be necessary. The contents of this document is based upon information available to the public that has been obtained
from sources considered to be reliable. However, such information has not been independently verified by BBVA and therefore no warranty, either
express or implicit, is given regarding its accuracy, integrity or correctness. BBVA accepts no liability of any type for any direct or indirect losses
arising from the use of the document or its contents. Investors should note that the past performance of securities or instruments or the historical
results of investments do not guarantee future performance.
The market prices of securities or instruments or the results of investments could fluctuate against the interests of investors. Investors
should be aware that they could even face a loss of their investment. Transactions in futures, options and securities or high-yield
securities can involve high risks and are not appropriate for every investor. Indeed, in the case of some investments, the potential losses
may exceed the amount of initial investment and, in such circumstances, investors may be required to pay more money to support those
losses. Thus, before undertaking any transaction with these instruments, investors should be aware of their operation, as well as the
rights, liabilities and risks implied by the same and the underlying stocks. Investors should also be aware that secondary markets for the
said instruments may be limited or even not exist.
BBVA or any of its affiliates, as well as their respective executives and employees, may have a position in any of the securities or instruments
referred to, directly or indirectly, in this document, or in any other related thereto; they may trade for their own account or for third-party account in
those securities, provide consulting or other services to the issuer of the aforementioned securities or instruments or to companies related thereto or
to their shareholders, executives or employees, or may have interests or perform transactions in those securities or instruments or related
investments before or after the publication of this report, to the extent permitted by the applicable law.
BBVA or any of its affiliates´ salespeople, traders, and other professionals may provide oral or written market commentary or trading strategies to its
clients that reflect opinions that are contrary to the opinions expressed herein. Furthermore, BBVA or any of its affiliates’ proprietary trading and
investing businesses may make investment decisions that are inconsistent with the recommendations expressed herein. No part of this document
may be (i) copied, photocopied or duplicated by any other form or means (ii) redistributed or (iii) quoted, without the prior written consent of BBVA.
No part of this report may be copied, conveyed, distributed or furnished to any person or entity in any country (or persons or entities in the same) in
which its distribution is prohibited by law. Failure to comply with these restrictions may breach the laws of the relevant jurisdiction.
This document is provided in the United Kingdom solely to those persons to whom it may be addressed according to the Financial Services and
Markets Act 2000 (Financial Promotion) Order 2001 and it is not to be directly or indirectly delivered to or distributed among any other type of
persons or entities. In particular, this document is only aimed at and can be delivered to the following persons or entities (i) those outside the United
Kingdom, (ii) those with expertise regarding investments as mentioned under Section 19(5) of Order 2001, (iii) high net worth entities and any other
person or entity under Section 49(1) of Order 2001 to whom the contents hereof can be legally revealed.
The remuneration system concerning the analyst/s author/s of this report is based on multiple criteria, including the revenues obtained by BBVA and,
indirectly, the results of BBVA Group in the fiscal year, which, in turn, include the results generated by the investment banking business;
nevertheless, they do not receive any remuneration based on revenues from any specific transaction in investment banking.
BBVA Bancomer and the rest of BBVA Group who are not members of FINRA (Financial Industry Regulatory Authority), are not subject to the rules
of disclosure for these members.
“BBVA Bancomer, BBVA and its subsidiaries, among which is BBVA Global Markets Research, are subject to the Corporate Policy Group
in the field of BBVA Securities Markets. In each jurisdiction in which BBVA is active in the Securities Markets, the policy is complemented
by an Internal Code of Conduct which complements the policy and guidelines in conjunction with other established guidelines to prevent
and avoid conflicts of interest with respect to recommendations issued by analysts among which is the separation of areas. Corporate
Policy is available at: www.bbva.com / Corporate Governance / Conduct in Securities Markets”.

CONTACT DETAILS:
BBVA Research – BBVA: Paseo de la Reforma 510, Colonia Juárez, 06600 Mexico City, Mexico
[email protected]om www.bbvaresearch.com
This report has been prepared by:
Chief Economist
Carlos Serrano
carlos.serrano@bbva.com
Fernando Balbuena
fernando.balbuena@bbva.com
Samuel Vázquez
samuel.vazquez@bbva.com
